My first challenge in building a GPU-operations lab was straightforward: I did not have a physical NVIDIA GPU. The surrounding infrastructure was already substantial. Project Pivot had a Kubernetes cluster, a virtual SONiC Clos, network telemetry, and later a physical 100GbE RoCE testbed. None of that equipment could supply a real CUDA device for Kubernetes to discover and schedule.
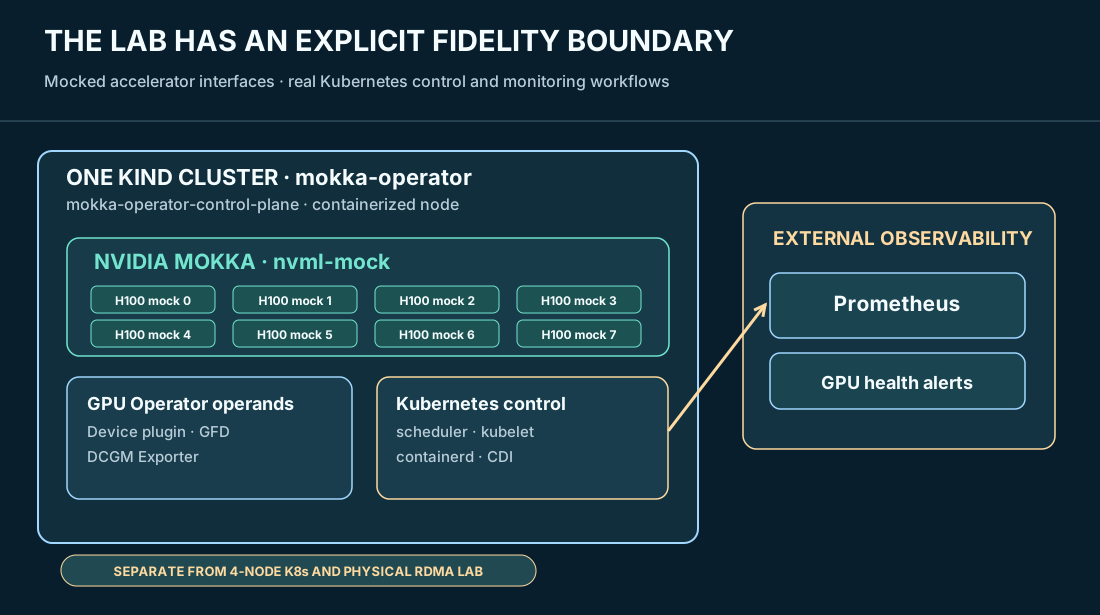
I used NVIDIA's Mokka nvml-mock implementation to fill that specific gap. The result was a single-node KIND cluster that presented eight simulated H100 GPUs, supported the NVIDIA GPU Operator components needed for discovery and allocation, and exposed GPU-like health signals through DCGM Exporter. It was useful because it forced me to work through the same management interfaces that appear in a hardware-backed cluster. It was limited because the GPUs, telemetry values, and injected failures were simulated.
01 / Why a GPU can appear in Kubernetes before one exists in silicon
The GPU Operator is an automation framework that manages several components of the NVIDIA Kubernetes GPU stack. Kubernetes itself does not query GPU PCI functions or enumerate H100s through the scheduler. Instead, a device plugin reports extended resources such as nvidia.com/gpu to the kubelet. The kubelet publishes node capacity and allocatable resources; the scheduler works from those reported values.
In my mock cluster, NVIDIA's nvml-mock presented the H100 profile with eight devices. The node mokka-operator-control-plane eventually reported eight nvidia.com/gpu in Capacity and eight in Allocatable. That was an API-level statement about resources exposed by the running device plugin, not a measurement of eight physical GPUs.
NVIDIA's GPU Feature Discovery (GFD) supplied GPU-related discovery metadata. The GPU Operator controlled the selected operand deployment. DCGM Exporter handled the metrics side. These responsibilities are easy to conflate because all the pods carry NVIDIA names, but the failure modes are different: a scheduler may reject a GPU request, a device plugin may report no capacity, a runtime may fail to inject a device, or a metrics collector may be unable to scrape an otherwise working node.
02 / Building the simulated node and its resource boundary
I ran the experiments in a KIND cluster named mokka-operator, with a single node named mokka-operator-control-plane. KIND ran Kubernetes inside a container; it was not an additional bare-metal GPU server. The nvml-mock chart was deployed with an H100 profile and eight devices. The GPU Operator installation used the mock-compatible approach rather than installing a physical NVIDIA kernel driver that the host did not have.
The stack I tested used Kubernetes v1.37.0 and containerd 2.3.4 on the KIND node, with nvml-mock chart 0.4.0 and NVIDIA GPU Operator v26.3.3. Those are recorded lab versions, not an instruction to install whatever version happens to be current. The cluster node's CPU and memory resources remained finite even while eight simulated GPU resources were advertised.
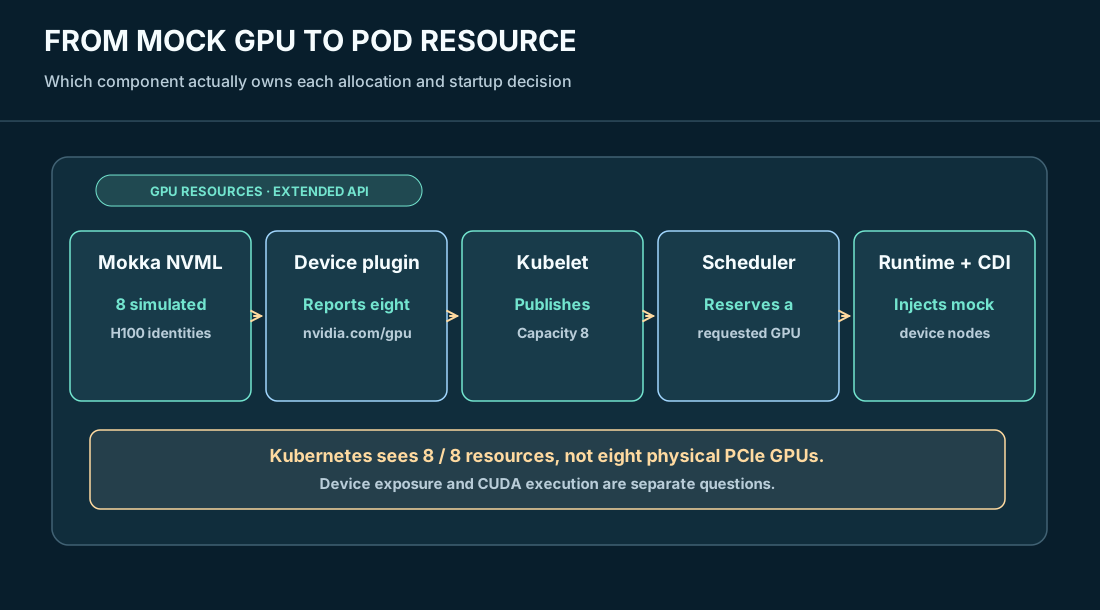
In this environment, the word capacity meant that the mock-backed resource plugin had reported eight devices. Allocatable expressed the count exposed for workloads before current allocations. Neither field reported CUDA capability, NVLink bandwidth, real HBM capacity, or whether a distributed training job would succeed on hardware.
03 / The first GPU Operator deployment failed before device allocation
My first attempt failed during the NVIDIA toolkit validation path. The visible symptoms included a RunContainerError for toolkit-validation and an NVML_ERROR_LIBRARY_NOT_FOUND condition. It would have been easy to label that a bad mock GPU. Instead, I followed the container startup path.
Mokka had generated the Container Device Interface (CDI) specification describing its eight simulated devices and the mocked NVML library mounts. But the configured runtime path could not successfully start the affected operator operand containers, so the persistent CDI device specification was not being consumed as intended. A valid CDI file alone does not guarantee that containerd and the selected runtime handler will make it into the container.
I rebuilt the affected KIND environment and corrected the container runtime integration and mock-specific operator configuration. With the runtime handler and CDI path aligned, I recreated the affected GPU Operator pods. GPU Feature Discovery, the NVIDIA device plugin, and DCGM Exporter reached Running state. I deliberately kept the mock installation separate from the real four-node Kubernetes cluster, avoiding a driver/toolkit experiment on the existing workers.
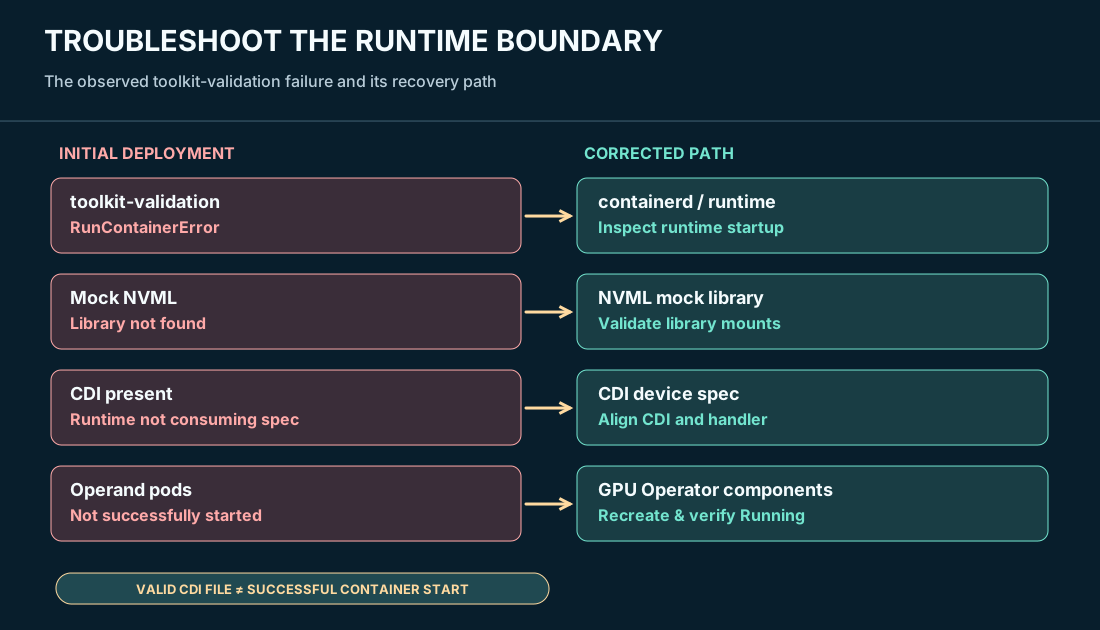
Operationally, this mattered more than a clean install would have. The chain crosses several ownership boundaries: the GPU Operator creates the desired Kubernetes components; the kubelet asks a container runtime to start them; containerd and the selected handler resolve how the simulated device nodes and libraries are presented. A failure at one boundary can leave the later, correctly configured component looking broken.
04 / Requesting a GPU means making an allocation decision
After the deployment stabilized, I used test pods to request the nvidia.com/gpu extended resource. A one-GPU request reached Running and exposed the mock /dev/nvidia* surfaces. I then used a saturation Deployment to reserve seven GPU resources and another test pod to consume the eighth. The cluster reported 8 of 8 simulated GPU resources allocated, with the test workloads Running. When I removed those workloads, requested GPU use returned to 0 of 8.
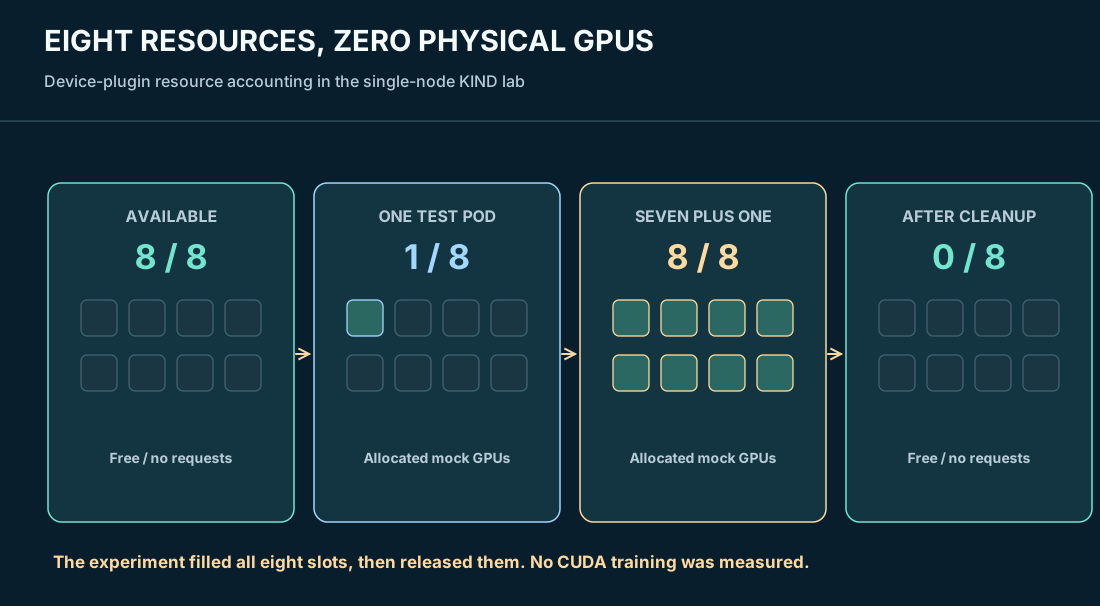
This exercise demonstrates how Kubernetes accounts for resources advertised by the plugin. It does not establish real H100 utilization, placement across separate servers, GPU memory pressure, NVLink connectivity, or a production scheduling benchmark. I also do not count a ninth Pending request as demonstrated unless a separate recorded scheduler event proves that specific condition; the observed saturation test filled the eighth slot.
The principal workflow is worth remembering: pod request → scheduler placement → kubelet device allocation → runtime/CDI injection → container process. A pod can be placed successfully and still fail during device injection. An apparent /dev/nvidia0 inside a container can still point to a mock device. Each checkpoint answers a different question.
05 / DCGM and Prometheus made the simulated devices observable
Next I connected the simulated GPU inventory to a monitoring pipeline. DCGM Exporter ran with the NVIDIA components and exposed GPU telemetry. I published a dedicated service named pivot-dcgm-exporter on NodePort 30400, mapped to port 9400, so the existing Prometheus service on automation-1 could scrape the KIND node at 172.20.0.2:30400/metrics.
The Prometheus scrape job was named pivot-gpu. It initially showed an unsuccessful target until the configuration and scrape path were corrected and the collector rolled forward. Once healthy, the exporter supplied GPU-oriented metrics to the existing observability platform. In particular, the incident tests used fields including DCGM_FI_DEV_XID_ERRORS, DCGM_FI_DEV_UNCORRECTABLE_REMAPPED_ROWS, and DCGM_FI_DEV_ROW_REMAP_FAILURE.
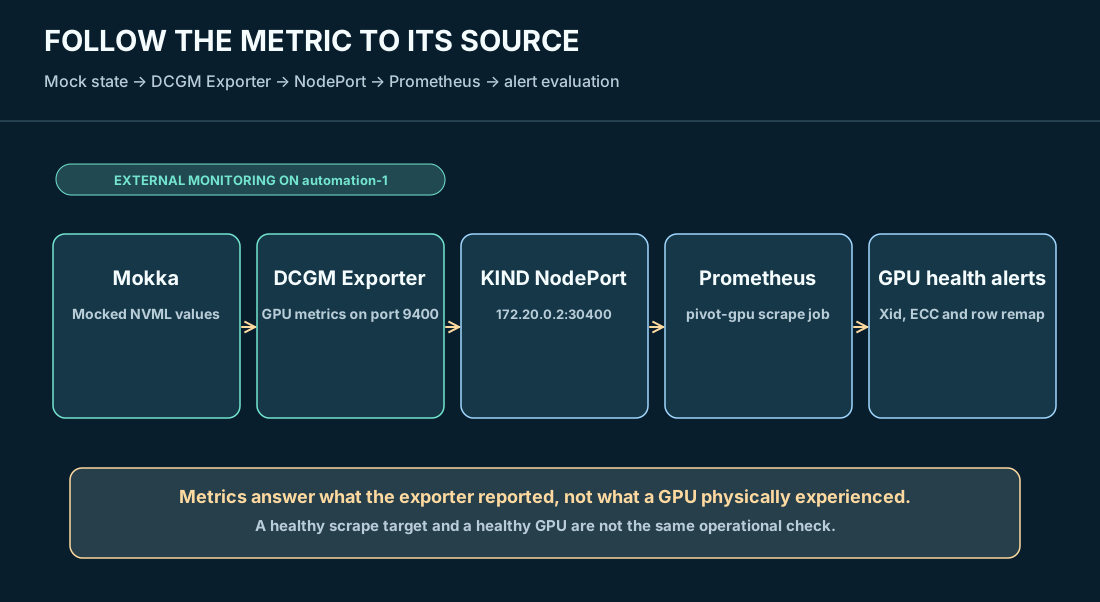
The telemetry chain is distinct from allocation. A device plugin can report GPUs while Prometheus cannot reach the exporter. Conversely, Prometheus can scrape a mocked metric even though no hardware is installed. For an operator, the correct interpretation requires combining node allocatable resources, pod status, the runtime, and exporter health, not selecting a single green dashboard tile.
06 / Injecting an Xid 79 incident, and interpreting recovery carefully
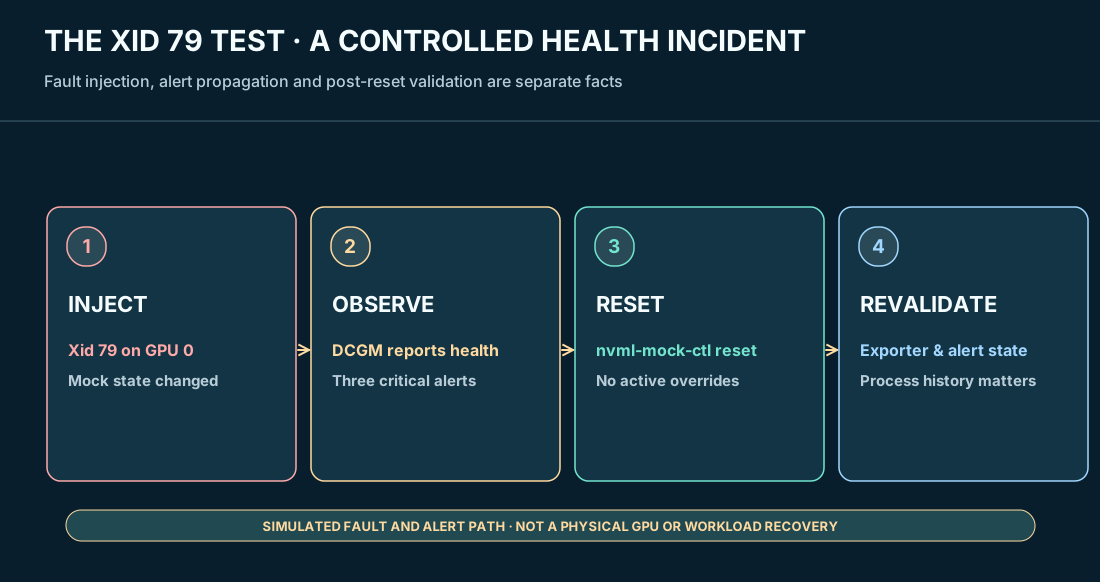
I then used nvml-mock-ctl to inject an uncorrectable-health condition against GPU 0, including Xid 79, the NVIDIA error commonly described as a device falling off the bus. In this lab, no physical PCIe GPU disappeared. Mokka changed the simulated health state that the NVIDIA software stack read through its mock interfaces.
The collected alert output later showed three critical GPU health conditions: PivotGPUXidError, PivotGPUUncorrectableRemappedRows, and PivotGPURowRemapFailure. That is meaningful operational evidence for the test: mock state propagated to DCGM-related metrics, Prometheus evaluated those values, and alert rules fired for the intended GPU.
I reset the fault through Mokka and verified that the mock status showed no active overrides. The record also includes restarting the DCGM Exporter after the reset. That matters because exporter/DCGM process state can retain a prior error value; a historical Xid indicator does not necessarily disappear at the instant the underlying mock state is cleared. I treated fault reset, exporter observation, and alert clearance as separate checkpoints rather than claiming that clearing an injected value automatically healed an actual GPU.
07 / What Mokka can teach and what still requires hardware
The mock environment was useful for NVIDIA component installation, NVML-driven discovery, Kubernetes GPU resource accounting, CDI/runtime troubleshooting, selected GPU health metrics, and alert handling. Those are worthwhile operational skills because misconfigurations in the device plugin, kubelet path, runtime or monitoring plane do happen in hardware-backed environments.
There are hard limits. Mokka does not turn an ordinary CPU into an H100. It did not validate physical SM execution, production CUDA workloads, real device memory behavior, GPU-to-GPU NVLink, PCIe reliability, GPUDirect RDMA, NCCL collective throughput, or thermal/power behavior of installed accelerators. The earlier virtual SONiC testbed proved network control-plane and forwarding behaviors; the later Z9100/ConnectX-5 lab proved bounded physical Ethernet and RDMA behaviors. This KIND lab proved mock-backed GPU management workflows. The three tracks are complementary, not interchangeable.
I would also keep the mock environment off production worker pools. Components that mount host paths, inject device files, expose runtime controls, or require privileged access demand careful namespace separation, image and chart pinning, restricted service accounts, controlled network access, and explicit cleanup. Exposing NodePort 30400 on a lab-only reachable address is an observability convenience, not a recommended unrestricted production configuration.
08 / The operational view: trace the first broken boundary
I approach these incidents the same way I approached routing and firewall escalations: establish the symptom and time window, then follow the dependency path until the evidence changes. If a GPU-requesting pod is Pending, I inspect scheduler events and resource accounting first. If it is scheduled but cannot start, I inspect kubelet, runtime, CDI and the assigned device surfaces. If it runs but its GPU telemetry disappears, I look at DCGM Exporter and Prometheus target health. If a GPU fault alert fires, I distinguish a current injected state from retained process metrics and ask whether the workload suffered any demonstrated impact.
The experiments did not require expensive accelerator silicon to expose those troubleshooting boundaries. They did require disciplined separation of what Kubernetes believed, what the mock library reported, and what an actual GPU could have done. That separation is the value I would carry into a GPU platform operations role.
The engineering conclusion: the GPU software stack can be learned without a GPU, provided that the simulated devices never become evidence of performance that was not measured.
Evidence trail
fabric/sonic-clos/docs/day15-mokka-gpu-operations-observability.md— mock GPU installation, GPU Operator troubleshooting, DCGM metrics, fault injection, and final teaching notes.- Project Pivot Day 15–16 terminal records — KIND/Helm setup, operator failure, eight-GPU allocation, NodePort access, and monitoring integration.
- Recorded Prometheus API output —
PivotGPUXidError,PivotGPUUncorrectableRemappedRows, andPivotGPURowRemapFailurefiring against GPU 0. Project_Pivot_Master_Execution_Plan_2026-09-20.md— intended GPU-operations fidelity boundaries and security controls. Planned items are not presented as completed tests.
Vendor references
- NVIDIA k8s-test-infra / Mokka — mock NVML, GPU profiles and integration workflows.
- NVIDIA mock GPU Operator troubleshooting — mock driver roots, CDI, and disabled real driver/toolkit operands.
- NVIDIA Cloud Native Technologies — GPU Operator, device plugin, GFD, container toolkit and DCGM Exporter responsibilities.
All diagrams are original editorial reconstructions of the recorded lab, not screenshots from a hardware-backed GPU cluster.