A 100GbE link can negotiate perfectly and still deliver disappointing application throughput. My first sustained TCP run through the physical Project Pivot testbed produced about 38.7 Gb/s, alongside 58,584 retransmissions and 65,717 receiver-side physical discards. The interface speed was not the problem. The experiment had to move inward from the switch ports through the NIC queues and ultimately into the host's NUMA layout.
I built the physical lab to get past the limits of a virtual SONiC Clos. With a real switch and NIC, I could inspect PCIe negotiation, physical link status, jumbo MTU behavior, hardware receive counters, interrupt placement, and RoCE operations. That gave me a different kind of evidence from the BGP/EVPN labs. It did not give me a multi-server GPU cluster, and I have kept those two facts separate throughout this work.
01 / The hardware I actually put on the wire
The hardware consisted of a Dell PowerEdge R430 running Proxmox VE 9.1.9, a dual-port NVIDIA ConnectX-5 Ex 100GbE adapter, and a Dell Z9100-ON running SmartFabric OS10 10.5.0.6C1. Two QSFP28 DAC links connected the NIC ports to switch interfaces Ethernet 1/1/3 and Ethernet 1/1/5. The switch carried VLAN 100 between those ports. The NIC used mlx5_core version 7.0.2-2-pve and firmware 16.35.1012.
I placed each NIC port in its own Linux network namespace, gpu-a and gpu-b. The final hardware acceptance record identifies the test endpoints as 10.100.0.1 and 10.100.0.2. Earlier Day 18 TCP tests used a separate 10.100.100.11/12 addressing snapshot. Both are historical configurations of the same physical topology, not two independent server pairs.
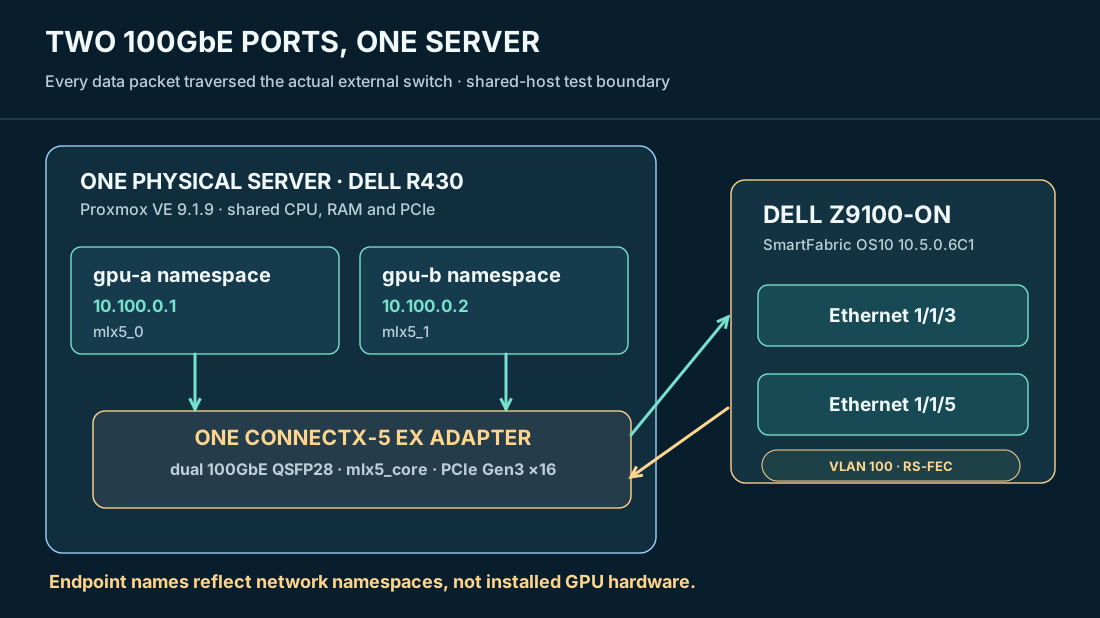
This is a valuable setup for validating real physical I/O and experimenting with RDMA. It is not a substitute for a pair of independent GPU servers. Host-memory traffic, interrupts, PCIe arbitration, and CPU scheduling can influence both ends of a test. I therefore treat every throughput number as an observation of this specific single-host setup, not an upper bound on what the switch or NIC can deliver elsewhere.
02 / Qualify the link before interpreting a benchmark
I began with basic physical evidence. Both ports negotiated 100GbE and used RS-FEC. The adapter's PCIe capability was 16 GT/s ×16, while the installed R430 negotiated 8 GT/s ×16, meaning PCIe Gen3 with the full x16 width. The platform's PCIe generation is a design constraint, but the test did not independently prove PCIe bandwidth was the exclusive limiting factor.
The host MTU was 9000 and the switch MTU was 9216. A Day 18 do-not-fragment ping with an 8,972-byte payload returned 4/4 replies, validating jumbo IP forwarding along the physical switch path for that test. The switch was running OS10. Physical SONiC migration was explicitly excluded from this equipment acceptance scope.
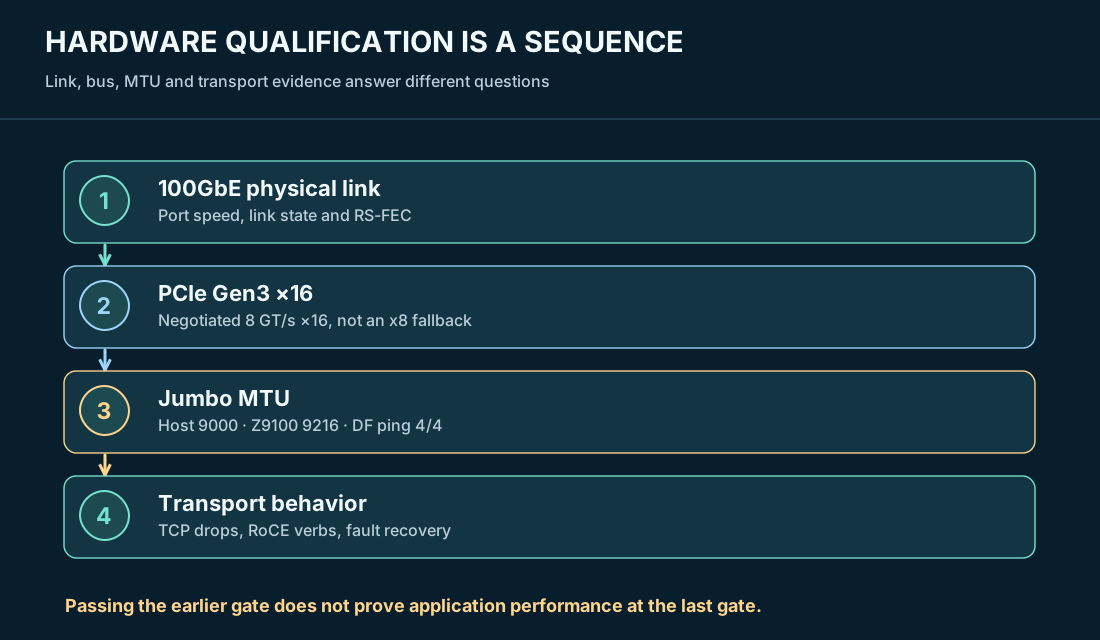
I also checked the driver, firmware, negotiated lane width, and per-port statistics before tuning anything. Without that inventory it would have been easy to mistake a negotiated-width problem for a queue-processing problem. The values stayed in the evidence record so a future engineer could reproduce the same starting state.
03 / The first TCP run was a receive-path investigation
For the initial host-side comparison I used iperf3 with 16 parallel TCP flows over 20 seconds. The receiver started with a 1,024-entry RX ring and 24 combined channels. The test delivered 38.7 Gb/s, but receiver rx_discards_phy grew by 65,717 while TCP reported 58,584 retransmissions.
Increasing the RX ring to 8,192 reduced retransmissions and hardware drops. It hardly changed the transfer rate: the next run reached 39.2 Gb/s, with 44,162 retransmissions and 44,096 receiver physical discards. The near-alignment of those two counters was a strong clue that NIC reception, rather than a BGP path or Ethernet negotiation problem, was driving much of the TCP loss. The counts are not a packet-by-packet proof that every retransmission resulted from one specific discard.
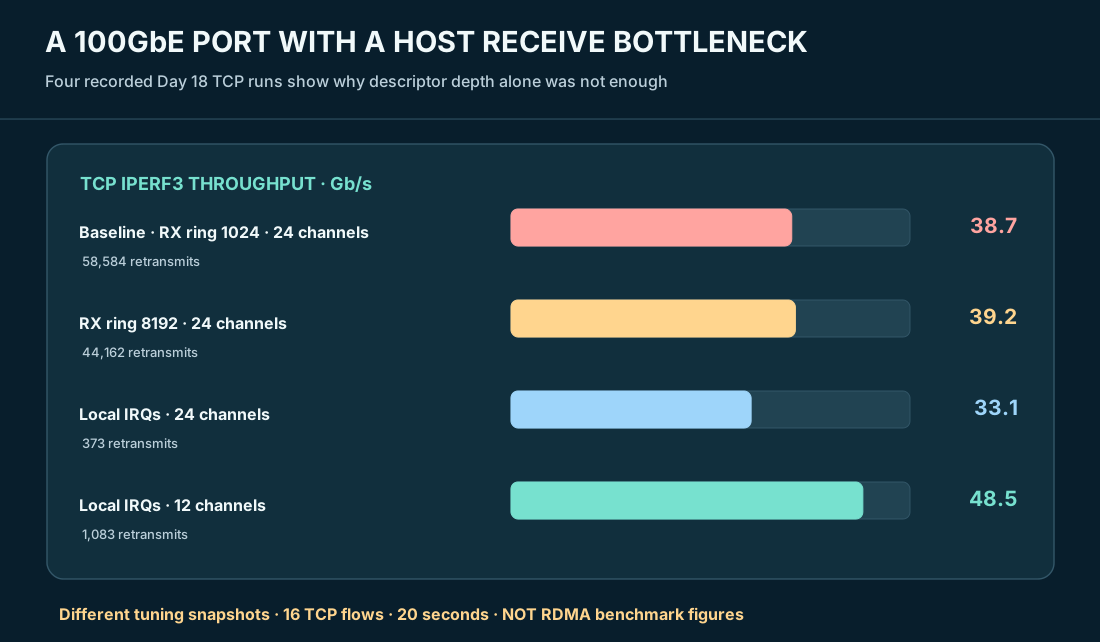
That next result was instructive. Moving all 24 completion IRQs onto the NIC-local NUMA node reduced retransmissions to 373 and receiver discards to 48, but throughput dropped to 33.1 Gb/s. Simply forcing locality reduced one problem while exposing another. I was now trying to service more active queues than were sensible for the available local CPU topology.
04 / NUMA placement and receive-queue count changed the outcome
The R430's dual-socket CPU layout supplied 24 logical CPUs across two NUMA nodes. The NIC was attached to NUMA node 0. Initially, 12 completion IRQs were associated with local CPUs and 12 with the remote node. RSS distributed traffic across all 24 receive queues, so the starting issue was not an obvious single-ring hash imbalance.
I then reduced the receiver from 24 combined channels to 12, kept the larger RX ring, and aligned the active completion interrupts with the 12 NUMA-0 logical CPUs. The subsequent test reached 48.5 Gb/s with 1,083 TCP retransmissions and approximately zero receiver physical drops during the recorded interval. Compared with the initial 38.7 Gb/s run, the measured transfer rate increased roughly 25%, with a substantial reduction in receiver drops.
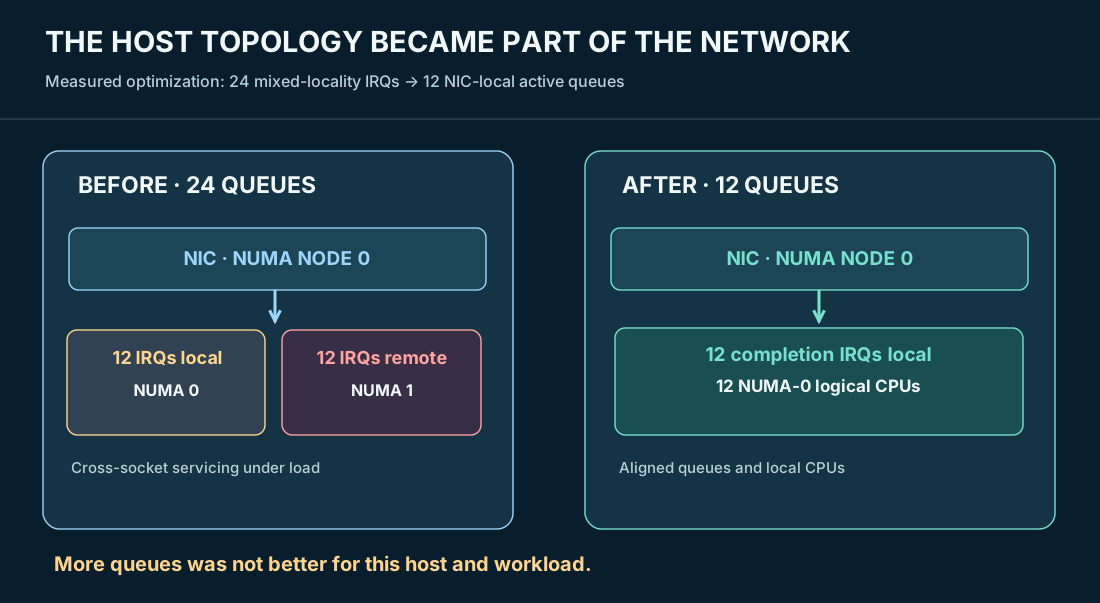
The sequence cautioned me against a familiar tuning shortcut: changing many settings and then crediting whichever one looks most interesting. Increasing descriptor depth reduced drops without fixing throughput. Moving IRQs local reduced loss but temporarily made throughput worse. Only after matching active queues to available local processing resources did this specific workload improve convincingly. Queue count, interrupt affinity, CPU locality, and application placement all belong in a high-speed Ethernet performance investigation.
I also preserved a limitation: the test does not isolate a single definitive throughput bottleneck. PCIe Gen3, one-host bidirectional resource sharing, CPU scheduling, packet size, and driver behavior can all contribute. The hardware was useful precisely because it made those interacting constraints visible.
05 / RDMA proved a different transport path
After the TCP investigation, I validated RoCEv2 using the NIC's RDMA-capable functions, GID index 3, and the perftest suite. RDMA WRITE, READ, and SEND exercise different verbs and pathways; they should not be treated as interchangeable measurements simply because they use the same wire.
The accepted physical hardware record summarized the achieved bandwidths as approximately 76.8 Gb/s WRITE, 67.3 Gb/s READ, and 47.7 Gb/s SEND. A 64 KiB RDMA WRITE run reported around 9,158 MiB/s, corresponding to roughly 76.8 Gb/s. Those are substantial hardware RDMA results for the available topology and clearly different from the earlier iperf3 TCP values.
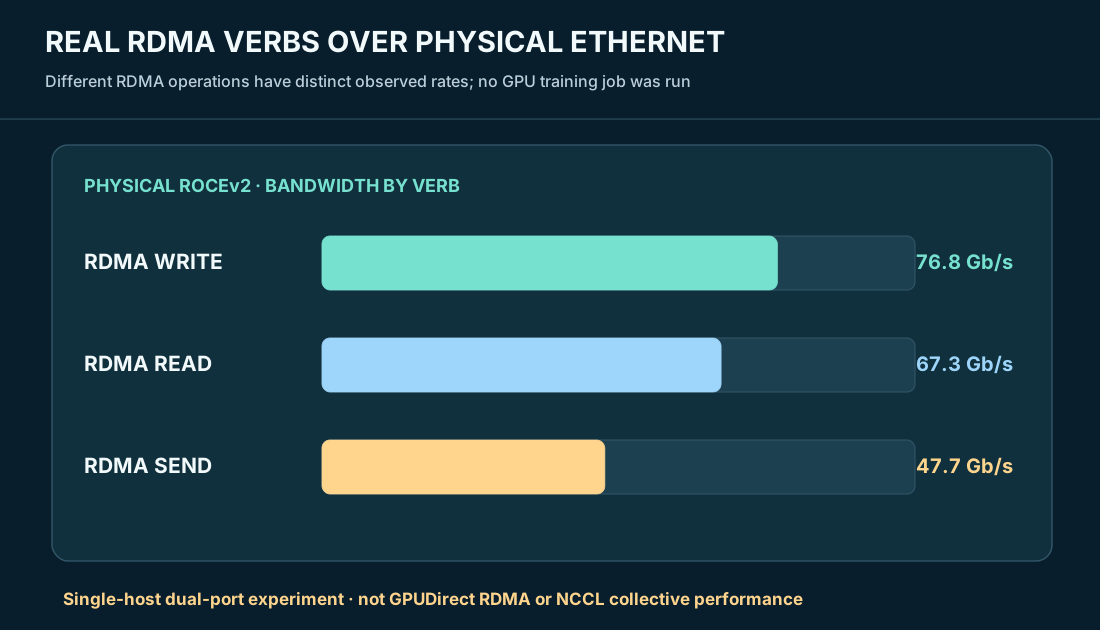
These results showed that the physical links, host adapter, and tested RDMA transport configurations could sustain meaningful throughput across an external Ethernet switch. They did not demonstrate GPUDirect RDMA, NCCL collectives, independent two-host performance, or production-scale RoCE deployment. None of those outcomes follows from a healthy RoCE WRITE result.
A separate Day 21 UDP test also showed how host defaults can corrupt a conclusion. At 5 Gb/s with 8,000-byte datagrams, the initial receiver dropped 12.2% of packets and exhibited corresponding receive-buffer errors. After requesting a 2 MiB socket receive window, the repeat 20-second test recorded zero loss out of 1,562,578 datagrams and 0.013 ms receiver jitter. That finding implicated socket buffering under the tested conditions. It was not a 100Gb/s UDP line-rate test.
06 / A link-up event did not repair the original RDMA connection
The fault experiment brought the physical receiving port down and later back up. The recorded mlx5_1 link transition was DOWN at 16:12:36 EDT and UP/ACTIVE at 16:13:19 EDT on October 8, an observed link-down interval of 43 seconds at one-second logging resolution.
The original reliable-connected (RC) workload failed with status 12 and syndrome 0x81. After physical connectivity returned, I established fresh RC queue pairs and ran another WRITE test. That fresh connection completed at 76.75 Gb/s. The important result was successful establishment and operation of a new RDMA communication context after the link was restored.
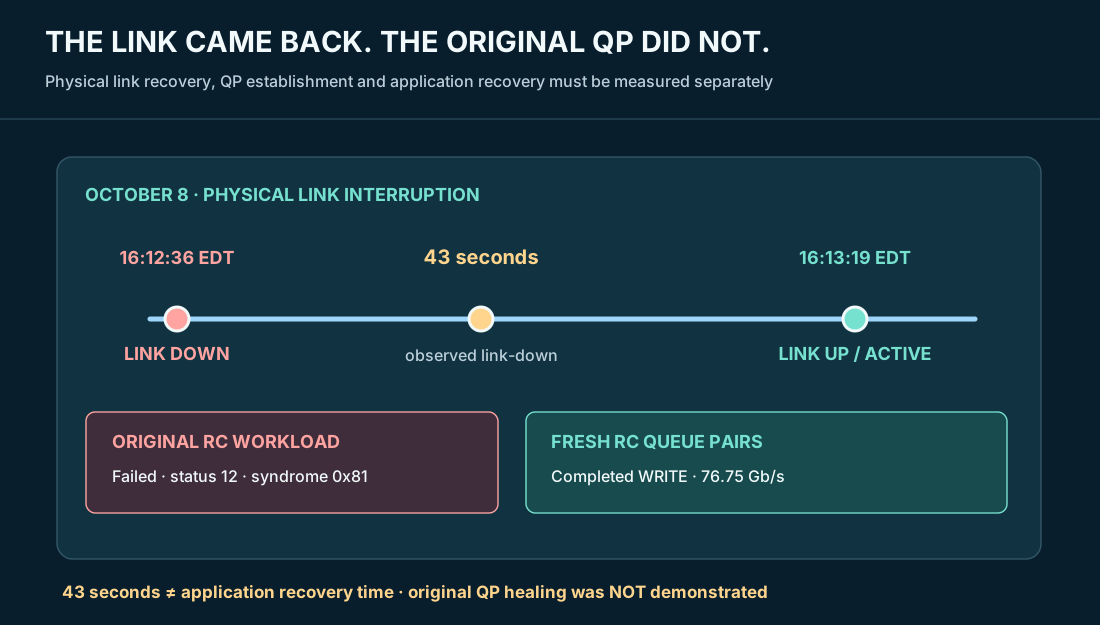
This matters for AI infrastructure operations because link recovery, RDMA QP state, and application recovery are separate things. Seeing LINK_UP is one signal. Establishing a new QP and completing an RDMA operation is another. Confirming that an existing distributed job restarted or resumed cleanly would require application-level evidence that this particular test did not collect.
07 / What the physical lab can and cannot establish
The strongest outcomes are specific: physical 100GbE links, RS-FEC and jumbo MTU validation, correct PCIe x16 negotiation, NIC drop/retransmission correlation, NUMA-sensitive throughput changes, physical RoCE verbs, and a fresh RDMA connection after link restoration. The hardware also supported the separate Article 04 tests of PFC, ECN and CNP congestion signaling.
The limitations matter just as much. The single R430 and dual-port ConnectX-5 are not two independent hosts. There were no physical GPUs participating in these benchmarks, no NCCL collective workload, and no independent multi-sender physical incast experiment. I did not prove that the original failed QP recovered without re-establishment or that PCIe Gen3 was the sole performance constraint. Independent DCQCN sender rate-reduction and recovery were not established, and further DCQCN testing was explicitly deferred during the accepted hardware closeout.
The Z9100 was never converted to SONiC. The virtual Containerlab SONiC Clos, with BGP, BFD, EVPN/VXLAN and routing-failure injection, is a separate evidence track. Keeping those environments labeled correctly is essential for anyone interpreting the diagrams or using this project as a reference for production planning.
I also avoided claiming the final publication/evidence archival gate had already passed based solely on the October 12 hardware technical record. That record still listed repository reconciliation and remote GitLab preservation as closeout items at the time it was prepared. Successful hardware testing and successful evidence publication are different milestones.
08 / The operational method I would carry into an AI fabric
My incident approach has always been to start with a specific failure window and follow the packet path. The physical lab extended that process inward: switch interface counters, NIC receive drops, transport retransmissions, RX rings, RSS channels, MSI-X placement, NUMA locality, and RDMA queue pairs all became part of the same investigation.
For a production AI fabric I would use the same sequence: confirm physical and protocol state, compare sender and receiver counters across the same time interval, inspect what the workload experienced, change one variable, and preserve the before/after evidence. A dashboard showing two healthy 100GbE links would not have explained the original TCP loss or the RDMA QP failure. The host and adapter counters did.
The engineering conclusion: 100GbE is a physical link speed, not an application performance guarantee. The most useful part of this project was proving exactly how far each piece of evidence reached, then stopping where the available hardware stopped being representative.
Evidence trail
fabric/sonic-clos/docs/day18-physical-100gbe-connectx5-z9100-validation.md— hardware, TCP/RSS/NUMA investigation, host benchmarking.fabric/sonic-clos/docs/day19-physical-rocev2-hardware-validation.md— GID/verb selection and hardware RoCE bandwidth.fabric/sonic-clos/docs/day20-physical-roce-qos-numa-validation.md— RDMA failure/recovery and hardware follow-up.fabric/sonic-clos/docs/day21-final-technical-record-20261012.md— accepted hardware scope, measured results, and limitations.fabric/sonic-clos/docs/purchase-objectives.md— original hardware acceptance objectives and final dispositions.
Vendor references
- Dell SmartFabric OS10 10.5.0 user guide — hardware-facing interface, QoS, and buffer command reference.
- NVIDIA RoCE networking architecture and QoS reference — comparative Ethernet/RoCE concepts; Cumulus commands do not apply to the installed OS10 switch.
Project Pivot test records contain host-specific log timestamps, counters, and lab-only IP addresses. All diagrams here are original editorial reconstructions of those records, not screenshots of a live production environment.