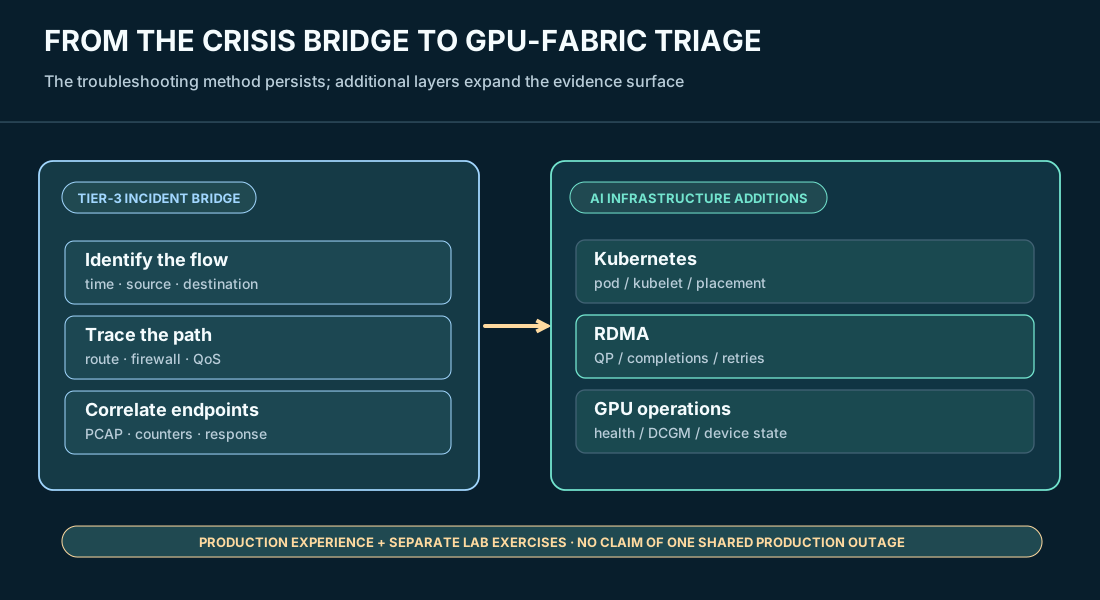
The most useful skill I carried from enterprise networking into AI infrastructure was developed on Tier-3 incident bridges. Someone would report that an application was slow, unreachable, or behaving inconsistently. I would establish when the problem started, identify the source and destination addresses and ports, trace the expected path, and compare the observations from each device that could affect it. Firewall policy and session counters, routing changes, interface drops, QoS, and packet captures often gave different parts of the story. When necessary, I captured packets at both ends and used Wireshark timing and sequence analysis to identify where the behavior diverged.
That work taught me to separate a symptom from the system responsible for it. A firewall can pass a flow while the receiver discards it. A routing neighbor can remain established while packets are blackholed. The application can suffer a long pause even after the control plane has recovered.
Project Pivot let me extend that investigation method into a more complex operational stack: Kubernetes placement and readiness, Linux networking, RDMA transport state, SONiC fabric control-plane events, and GPU-management telemetry. I did not have a physical GPU training cluster. Instead, I exercised three independent, bounded failure scenarios in the respective lab environments, then organized their evidence as an AI-infrastructure incident triage method.
01 / Start with the service report, not the red dashboard
On a crisis bridge, the opening question matters. “The network is slow” is not a testable failure description. I want the affected job or application, the exact time window, source and destination, transport and ports, expected behavior, and the first measured deviation. I then check whether the problem affects one flow, all traffic to a destination, one workload node, or an entire failure domain.
A distributed GPU workload adds its own questions. Was the pod scheduled? Did the runtime make the assigned devices available? Did the job stall during a communication operation? Is a host-level RDMA queue pair reporting retries? Did an accelerator health alarm coincide with the symptom? Those are investigation questions, not claims that Project Pivot ran a distributed training job.
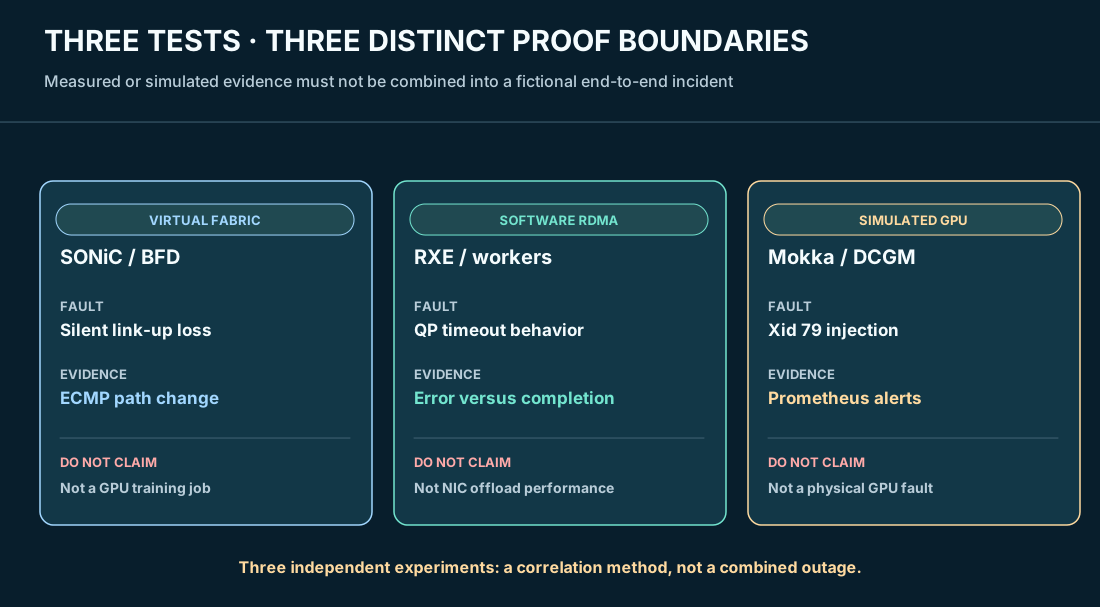
The evidence also has to be scoped correctly. My five-switch virtual SONiC Clos and Linux endpoints provided one kind of network evidence. My separate two-worker Soft-RoCE experiment provided transport-state evidence. A single-node KIND/Mokka cluster with eight simulated H100s provided GPU-management and alert evidence. A fault in one lab does not establish that a job in another lab suffered a related outage.
That separation is operationally useful. It forces the incident record to identify what was actually observed before anyone turns a plausible explanation into a root cause.
02 / Network track: an interface stayed up while forwarding failed
In the SONiC Clos, I tested failure handling on the routed leaf/spine underlay. The topology used two spines and three leaves, with eBGP, ECMP, and BFD. In one experiment, I deliberately dropped packets on leaf1 Ethernet0 using a Linux traffic-control impairment while the interface remained logically up. The Linux interface status still included UP and LOWER_UP. A simple link-state dashboard would not have captured the actual fault.
BFD was configured on the routing adjacencies. During the silent failure, the affected BFD relationship degraded, the routing path changed, and the remote leaf loopback became reachable through the surviving leaf1 Ethernet4 uplink toward the other spine. The workload-aware testing also exercised a 500 Mbit/s UDP stream, with interface counters and routing state collected during the event.
A different Day 5 experiment used hard interface shutdown rather than silent loss. It measured workload recovery of 1.896 seconds for the path initially using spine2 and 2.056 seconds for the path initially using spine1. Each test lost nine consecutive pings; both existing TCP sessions survived the tested path failure. Those timings belong to the hard-down tests, not the later silent-blackhole experiment.
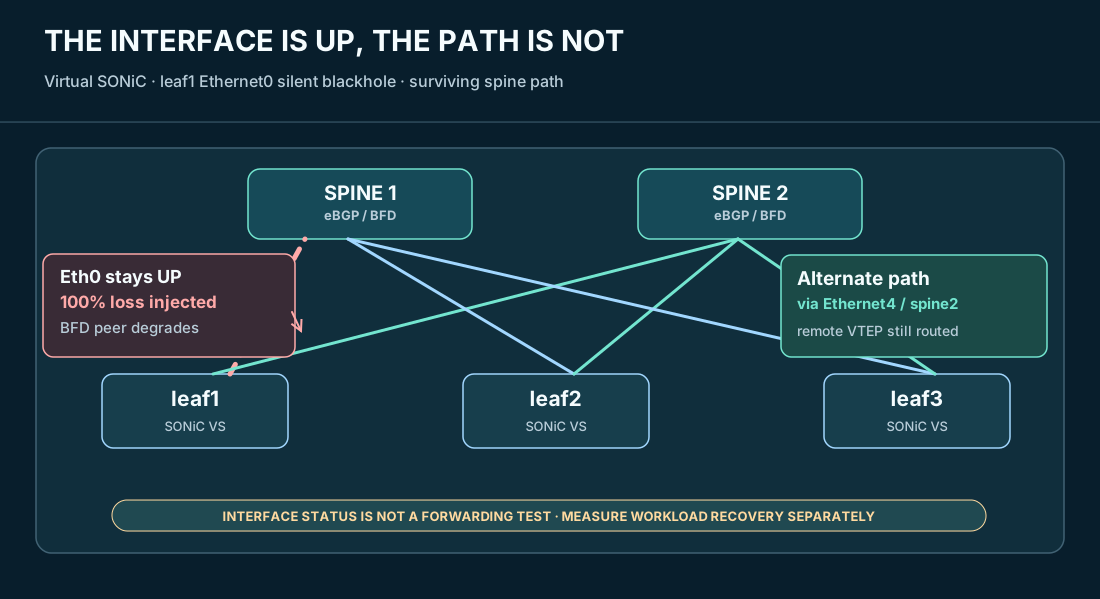
In my subsequent cross-layer check, a brief silent impairment changed the fabric control-plane observations while Kubernetes node readiness remained stable. That was useful evidence about failure-domain isolation: the tested Kubernetes health indicators did not fail with the virtual fabric event. It was not proof that an actual distributed GPU operation would continue unaffected.
This is the first rule I apply during triage: interface up, BGP healthy, and application healthy are three distinct claims. Each requires independent evidence.
03 / Transport track: RDMA can fail without an Ethernet link going down
The next investigation moved to Soft-RoCE (RXE) on two Kubernetes worker VMs, using their secondary Ethernet interfaces. kube-worker1 used 10.50.20.21, kube-worker2 used 10.50.20.22, and each exposed an rxe0 device. These were separate hosts at the VM level, but the RDMA implementation was software-based. The exercise did not validate ConnectX hardware offload or a GPU-to-GPU fabric.
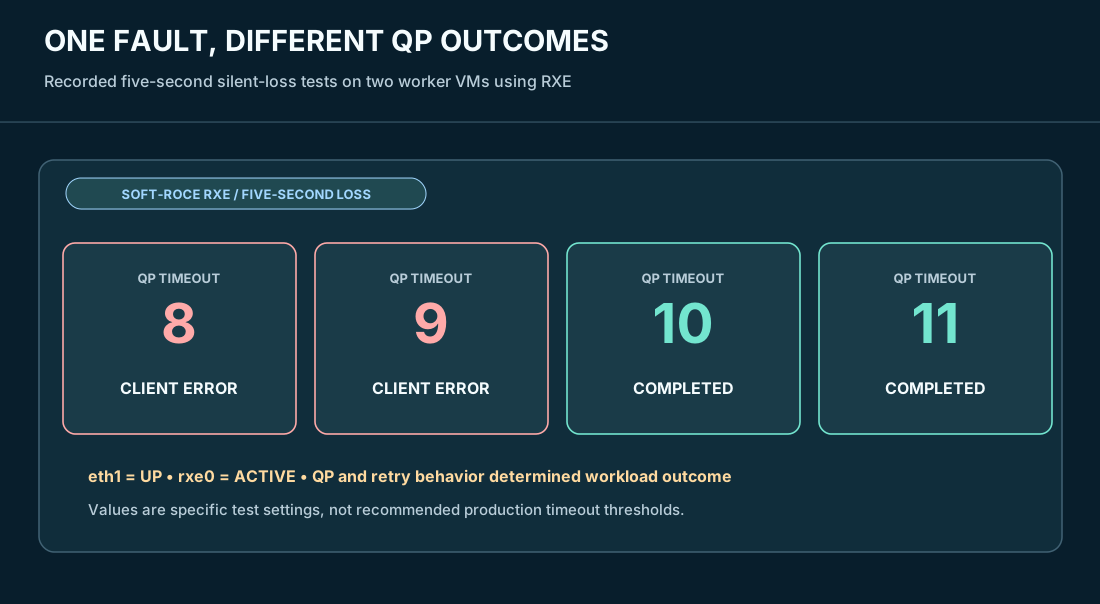
I ran an ib_write_bw workload through a fault-injection harness and introduced five seconds of silent packet loss. During the impairment, eth1 could remain UP and the RDMA link could still report ACTIVE. The more meaningful information was inside the reliable-connected queue-pair state, packet sequence progress, completion behavior, and retry counters.
A controlled series demonstrated that the configured QP timeout changed the outcome for the same kind of five-second impairment. In recorded trials, timeout values 8 and 9 resulted in client errors, while 10 and 11 completed successfully. These values are settings and outcomes for this specific RXE test; they are not a production recommendation or a universal cutoff. A particular timeout value must be interpreted with the RDMA transport's timer encoding, retry parameters, workload and implementation.
The inspection showed the local QP in RTS and the remote side in RTR at captured checkpoints, with packet-sequence changes and retry-related counters. The counter completer_retry_err increased during these tests. That provided evidence of transport recovery pressure that a basic ip link query could not reveal.
I would not conclude “the network was fine” from successful ICMP alone. I would also not conclude “the RDMA adapter is defective” from a failed work request. The evidence chain has to include both endpoints: transport errors, queue-pair states, local and remote counters, loss injection, and the application's final disposition.
04 / GPU track: the health alert had a real monitoring path and a mock source
The GPU-management investigation ran in another environment entirely: a KIND cluster named mokka-operator, with eight simulated H100 device resources exposed through NVIDIA Mokka and the GPU Operator components. The mock devices were allocated through Kubernetes using nvidia.com/gpu and monitored through DCGM Exporter. Prometheus on automation-1 scraped the exporter through NodePort 30400.
I injected a simulated Xid 79 condition against mock GPU 0. The recorded monitoring output showed critical alerts named PivotGPUXidError, PivotGPUUncorrectableRemappedRows, and PivotGPURowRemapFailure. The chain from simulated NVML state through DCGM-related metrics into Prometheus alert evaluation was demonstrated.
After the exercise, I reset the mock health override and confirmed that Mokka reported no active overrides. The exporter was also restarted during the recovery sequence. That last step matters: an exporter process can retain a previously observed error value after the underlying simulated fault is cleared, so the source state, exporter state, and active alert state need their own checks.
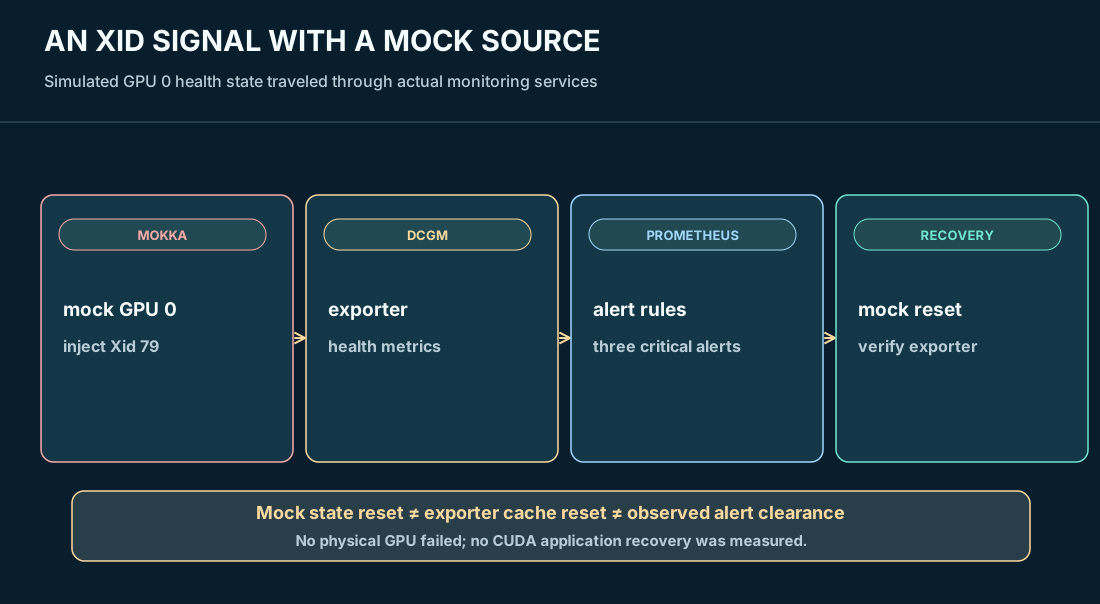
A GPU health alarm would be highly relevant to a genuine GPU-cluster incident. Here, it demonstrates the diagnostic interface, not the failure of real silicon. Keeping that distinction visible makes the test more credible, not less.
05 / Build a differential diagnosis across the layers
With these tracks in place, I can organize a triage sequence that avoids premature blame. I start with the workload symptom and time. Then I check resource placement and process state, the host data interface, the appropriate RDMA transport status, the fabric's selected route and forwarding evidence, and GPU-health telemetry where the workload actually uses GPUs. I do not declare a root cause simply because one counter moved or one dashboard turned red.
| Observation | Next investigation | What it does not prove |
|---|---|---|
| Pod is Pending or cannot start | Scheduler events, available GPU resources, kubelet, container runtime and CDI | Network fabric congestion |
| Interface is UP but packets disappear | BFD, per-path counters, routes, packet capture at both ends | Application recovery or GPU failure |
| RDMA work request stalls or errors | QP state, completion result, PSN progress, transport retry counters, receiver state | Hardware GPU or NIC failure in an RXE test |
| DCGM reports an Xid | Device health state, source process, exporter freshness, workload evidence | Physical failure when the source is Mokka |
| Kubernetes nodes remain Ready | Continue testing the affected workload data path | That all pod-to-pod traffic or RDMA communication is healthy |
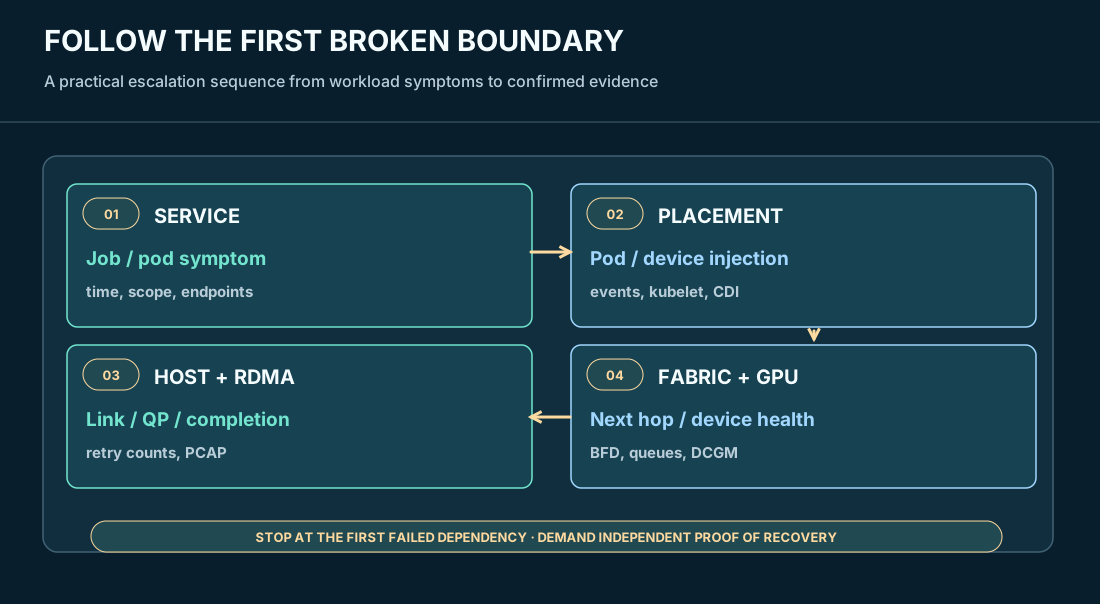
This approach is familiar from a firewall escalation. Source-to-destination reachability, the firewall policy decision, session state, routing symmetry, and actual packet delivery can disagree. The GPU fabric adds more moving parts, but the useful response is still to identify the first layer where the evidence stops agreeing with the expected behavior.
06 / Make telemetry answer operational questions
Project Pivot already had useful telemetry layers: SONiC and FRR state for BFD, BGP, EVPN, interfaces and reachability; Kubernetes node and workload indicators; and mock GPU health metrics from DCGM Exporter. Prometheus and Grafana made it possible to view different indicators across shared monitoring infrastructure.
In a Day 10 operator view, the fabric device count was five, the Kubernetes cluster reported four Ready nodes, and the pivot-web workload reported 2/2 replicas. These values are a recorded baseline, not an invented snapshot from the exact moment of every fault in this article. Likewise, the Mokka monitoring path was a separate single-node KIND cluster, not a GPU workload deployed across the four-node Kubernetes cluster and attached to the physical Z9100.
The next step for a production operator is correlation, not merely collection. For every signal, I want to know the collecting component, scrape freshness, node identity, interface or GPU identity, timestamp, and the experiment or incident it belongs to. Missing telemetry is itself an operational condition; a green result based on old samples deserves no more trust than a stale routing table.
07 / Write the incident record someone else can use
When I was the final network and firewall escalation on a production bridge, I wanted the next engineer to have a usable sequence of facts rather than another collection of screenshots without context. The same standard applies here. A credible incident record identifies the affected service and test boundary, time window and clock source, exact change or fault injection, pre-fault baseline, observations during the failure, recovery action, and independent post-recovery checks.
For a fabric impairment, that means BFD and BGP state, actual selected next hops, interface counters, test-flow identity, and workload loss or throughput observations. For an RDMA failure, that means both endpoint QPs, transport error and retry counters, link status, the precise timeout/retry configuration, and the client result. For a GPU alert, that means Mokka versus physical origin, Xid field and device, exporter target health, active alert state, and whether a real workload suffered any verified impact.
The important practice is labeling demonstrated, measured, simulated, unverified, and not tested facts accurately. These categories are part of the technical result. They tell an on-call engineer which conclusions can support an operational decision and which still need verification.
08 / What this changes for an AI fabric SRE
My enterprise networking background gave me a solid method for incident isolation. The Project Pivot exercises expanded the surface on which that method has to operate. I can no longer stop at the routing table, because RDMA completion behavior may be the failing layer. I cannot stop at a Kubernetes Ready condition, because that does not guarantee useful data-path delivery. I cannot stop at an Xid alert without knowing whether the metric came from physical hardware or a simulated library.
I also cannot treat three independent tests as one integrated incident just because their diagrams fit on the same page. A future full GPU training system would need its own correlated workload, topology, telemetry, failure injection, and recovery evidence.
The operational conclusion: find the first broken dependency, preserve the evidence that identifies it, and measure recovery at the workload boundary. That's the approach I brought from the crisis bridge, and it is the approach I would use when responsible for an AI fabric.
Evidence trail
fabric/sonic-clos/docs/day10-cross-layer-observability.md— Kubernetes/fabric baseline and silent-forwarding incident observations.fabric/sonic-clos/docs/day13-rdma-failure-recovery-observability.mdandfabric/sonic-clos/docs/day14-roce-rdma-incident-triage.md— Soft-RoCE fault harness, QP states, transport counters, and incident method.fabric/sonic-clos/docs/day15-mokka-gpu-operations-observability.mdandfabric/sonic-clos/docs/day16-gpu-scheduling-health-failure-recovery-kubernetes-gpu-architecture.md— Mokka, allocation path, DCGM, and simulated GPU fault observations.fabric/sonic-clos/docs/day17-cross-layer-ai-infrastructure-incident-triage.md— cross-layer triage documentation and supporting fabric/device checks.fabric/sonic-clos/docs/day5-workload-failover.mdandfabric/sonic-clos/docs/day8-workload-convergence.md— hard-down recovery measurements and silent-forwarding workload checks.- Day 13 host terminal records and October 2026 Prometheus alert API output — captured transport behavior and mock GPU health alert observations.
Technical references
- FRRouting BFD documentation — BFD detection and routing-protocol integration.
- NVIDIA DCGM Exporter documentation — GPU health metrics and exporter observations.
- Kubernetes troubleshooting documentation — Kubernetes workload, node, and cluster investigation entry points.
Figures are original technical reconstructions. No combined production GPU cluster, NCCL training outage, or fully integrated end-to-end AI job was demonstrated by these separate experiments.