A 100GbE link can remain operational while a small RDMA message takes dozens of times longer to complete. During Project Pivot, I measured average 64-byte RDMA SEND latency of 1.53 microseconds unloaded, 63.57 microseconds under deliberate congestion, and 1.69 microseconds after recovery. The links did not need to fail for application-facing performance to deteriorate.
That result pushed the investigation well beyond interface speed and packet loss. I wanted to see how the switch classified RoCEv2 traffic, where that traffic queued, whether priority-specific pause frames reached the adapter, whether the switch actually marked congestion, and whether the receiving adapter generated feedback to the sender. Those are different observations. Treating one as proof of another is an easy way to claim a working congestion-control loop that nobody has actually measured.
The physical work also exposed an important limitation. I proved switch ECN marking and end-host CNP feedback, but did not independently prove DCQCN sender-rate reduction and recovery. The distinction is central to this article.
01 / Start with the actual path
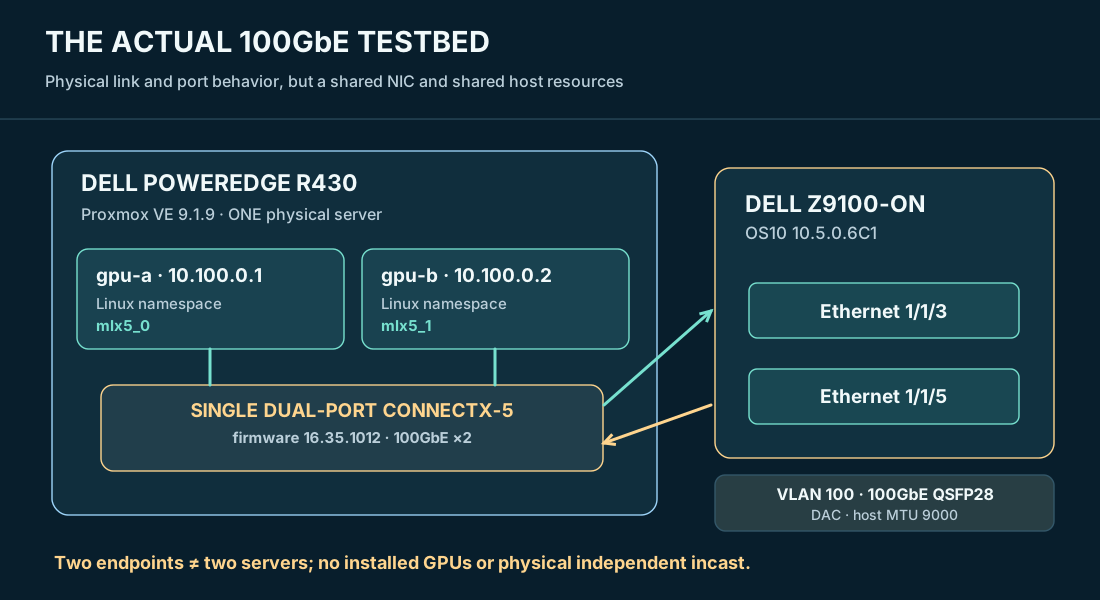
The physical testbed used a Dell PowerEdge R430 running Proxmox VE 9.1.9, one dual-port NVIDIA ConnectX-5 100GbE adapter, and a Dell Z9100-ON switch running SmartFabric OS10 10.5.0.6C1. The ConnectX-5 firmware was 16.35.1012, with Linux mlx5_core driver 7.0.2-2-pve. Two Linux network namespaces separated the test contexts:
gpu-a:mlx5_0,10.100.0.1, connected to OS10Ethernet 1/1/3.gpu-b:mlx5_1,10.100.0.2, connected to OS10Ethernet 1/1/5.
The path used 100GbE QSFP28 DACs and VLAN 100. The hosts used MTU 9000 and the switch MTU 9216. Both ports were on the same physical adapter in the same server. The labels gpu-a and gpu-b refer to simulated endpoint namespaces, not installed GPUs and not independent physical compute nodes.
Earlier physical validation established a useful RoCE bandwidth baseline: approximately 76.8 Gb/s RDMA WRITE, 67.3 Gb/s READ, and 47.7 Gb/s SEND, under the recorded same-host conditions. That baseline did not settle the congestion questions. I then introduced intentional egress queue-3 shaping to make the hardware's signaling behavior observable.
02 / Get the traffic into the intended queue
Congestion experiments are nearly meaningless if the traffic never enters the queue being controlled. On the Z9100, the documented and observed mapping was DSCP 26 → traffic class 3 → egress queue 3. The network-QoS policy matched qos-group 3 and applied priority-3 PFC where configured. Queue 3 was also associated with the controlled shaping and ECN-enabled WRED experiment.
On the sender, the traffic-class value used in the RoCE test was 106, representing DSCP 26 in the upper six IP traffic-class bits with ECN-capable transport bits included. It would be incorrect to call the decimal value 106 the DSCP value. The DSCP value was 26.
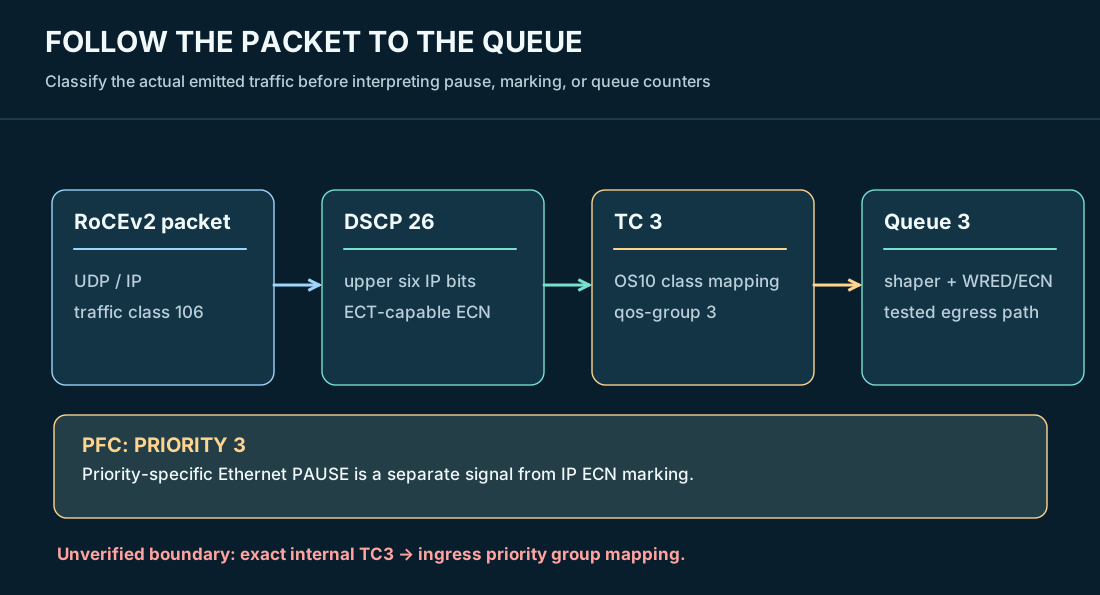
I verified the mapping through the switch's QoS state and the adapter's priority accounting. Before the host Data Center Bridging change, the comparison showed traffic counted against priority 0. After the change, priority-3 byte accounting increased while priority-0 growth became negligible for the tested workload. That is more useful than pointing at a policy name and assuming the packets obey it.
The rule I carried forward was to establish the transmitted traffic class, the switch classification, and the observed queue counters as distinct checkpoints. A misclassified RoCE stream can bypass the carefully tuned queue entirely.
03 / PFC: validate the frame, not just the setting
Priority Flow Control is an Ethernet mechanism that pauses an individual traffic priority on an adjacent link. It is local, hop-by-hop backpressure, not an end-to-end instruction to the RDMA sender to reduce its offered rate. That difference matters because PFC can stop a queue temporarily while ECN/CNP feedback provides a separate congestion signal farther up the communication path.
During the October 10 synchronized comparison, the switch and adapter recorded aligned changes:
| Synchronized observation | Delta |
|---|---|
Z9100 Eth1/1/3 priority-3 PFC transmitted |
+3,016 |
| GPU-A adapter priority-3 PFC received indication | +3,016 |
| GPU-A adapter physical PAUSE received | +3,016 |
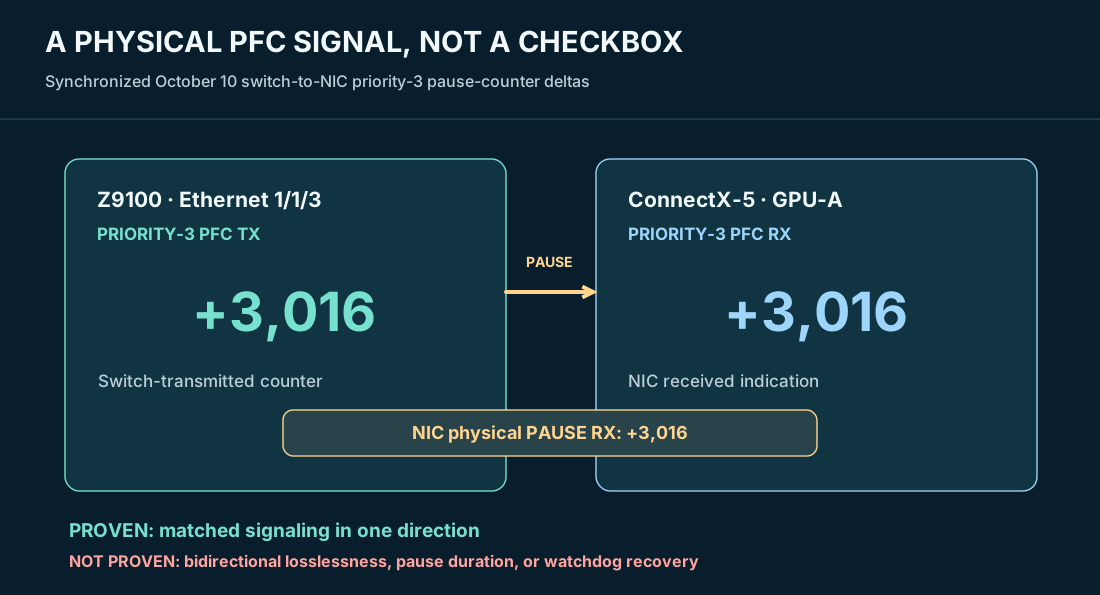
I was careful not to describe the two adapter ports as identically configured. GPU-A had priority-3 PFC enabled for this exercise; GPU-B did not have a corresponding verified enabled configuration. The evidence supports one tested direction. It does not establish bidirectional lossless operation or a production-ready PFC headroom design.
PFC also has operational risks: insufficient headroom can still result in drops, while excessive or uncontrolled pause propagation can create head-of-line blocking and deadlock conditions. I did not establish a vendor-supported PFC watchdog/deadlock recovery mechanism on this installed OS10 build, and did not inject a deadlock. That capability remains a documented limitation rather than an asserted hardware deficiency.
04 / ECN and CNP: the complete observed signaling chain
RoCEv2 uses IP ECN bits to communicate congestion without requiring the congested switch to discard an ECN-capable packet. When the switch marks an IP packet CE (Congestion Experienced), the receiving RDMA adapter can generate a Congestion Notification Packet (CNP) toward the transmitting adapter. The transmitter can then use that signal as input to rate control. Seeing CE marks and CNP handling is proof of feedback; sender-rate adaptation requires another measurement.
On October 12, I ran a controlled physical RDMA WRITE experiment from GPU-A to GPU-B over the Z9100, using 65,536-byte messages and GID index 3. Queue 3 was shaped to approximately 6 Gb/s. The recorded transfer operated around 5.5–5.9 Gb/s in that congested configuration.
The strongest evidence came from synchronized before/after counter captures:
| Device and counter | Before | After | Difference |
|---|---|---|---|
Z9100 Eth1/1/5 ASIC ECN-marked packets |
361,573 | 498,447 | +136,874 |
| GPU-B CE-marked RoCE packets received | 107,000 | 243,874 | +136,874 |
| GPU-B CNP transmitted | 59,034 | 131,302 | +72,268 |
| GPU-A CNP handled | 59,256 | 131,804 | +72,548 |
| GPU-A CNP ignored | 0 | 0 | 0 |
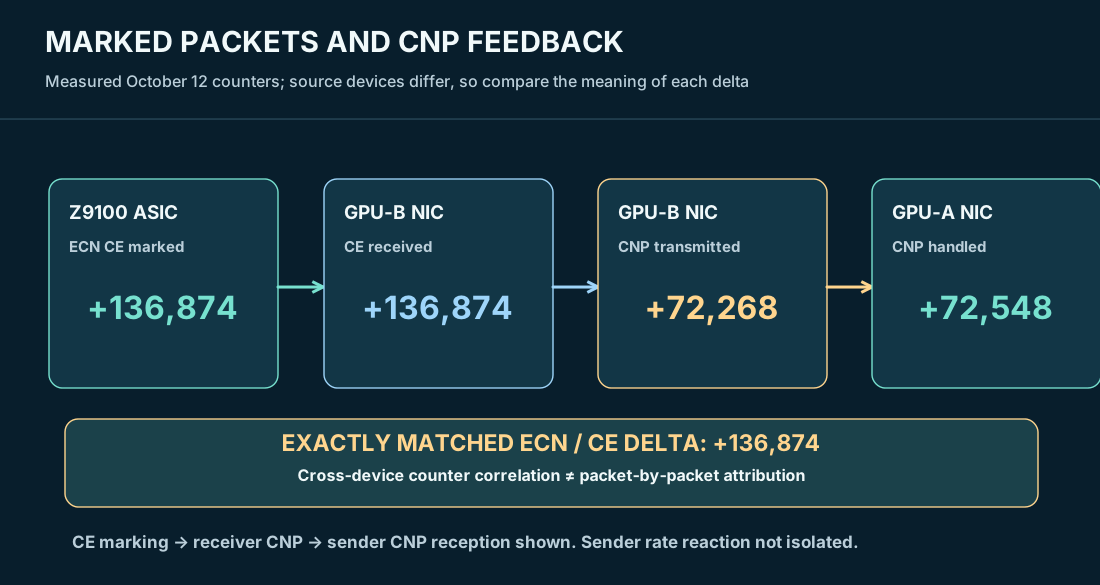
The switch and receiver CE differences matched exactly within that comparison. WRED and queue-3 drop counters remained at zero in the observed sample. This supported the conclusion that the physical fabric marked congestion and the two NIC roles processed corresponding feedback.
There were also test-harness imperfections: one receiver process expired before its sender started, and another produced a socket-exchange error on shutdown. Those events must remain in the test record. Neither can be presented as evidence of an ECN transport failure. And I cannot infer packet loss from the modest difference between the sender and receiver CNP deltas without synchronized packet-level attribution.
05 / Why the 6 Gb/s test did not prove DCQCN
The experiment separated the congestion feedback signal from the more difficult question of what independently controlled the sending rate. DCQCN is a RoCE congestion-control mechanism in which adapter rate control can react to congestion notification, reducing and later recovering the offered sending rate. The relevant measurements are the sender's adapter rate-control behavior and actual offered rate while other constraints are controlled.
The physical experiment intentionally used a hardware queue shaper. Across three conditions, I measured approximately 5.82 Gb/s with shaping attached, 48.08 Gb/s after removing it, and 6.00 Gb/s when shaping was restored. ECN marking and CNP feedback appeared during congestion. That sequence demonstrated the shaper's effect and the signaling path, but the shaper itself was an independent limit on observed throughput.
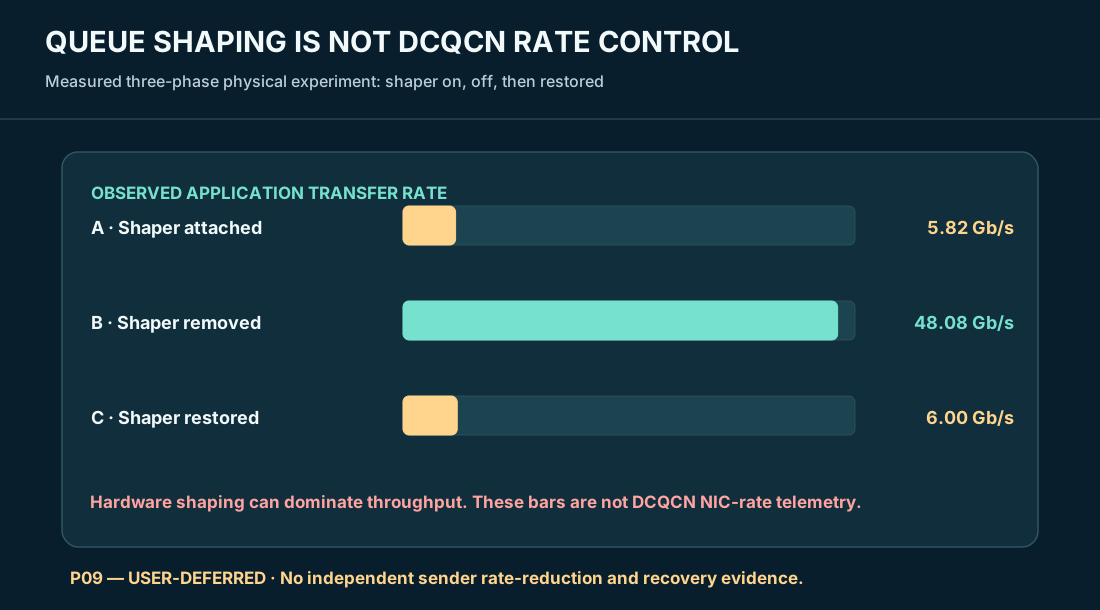
PFC could also affect the path during the experiment. Without a controlled and supported measurement that isolates NIC rate-control transitions from shaping, pause, host placement, and other effects, I cannot attribute the observed throughput change specifically to DCQCN.
The purchase-objective register therefore records P09 as USER-DEFERRED. No further DCQCN experiment was required after the October 12 hardware closeout decision. It is possible to establish that a sender received CNPs while leaving its independent rate-reaction mechanism unproven. That is the correct disposition for this lab.
06 / Buffer visibility and the part I could not map
The Z9100 provided useful ASIC buffer and queue visibility. I captured an ingress PG0 reserved buffer value of 183,040, XOFF 37,440, and XON 9,360 in the recorded switch output. Historical observations included an ingress PG0 shared peak of 681,824, a headroom peak of 145,600, and an egress queue-3 peak of 864,864 reported units. The switch also reported system-level lossless buffer allocations.
Those are not automatically interchangeable numbers. They came from different ASIC counter and configuration views, with different meanings and potentially different reporting units. Historical peaks could not be assigned exclusively to a single test window. Most importantly, the exact internal TC3-to-ingress-PG relationship was not proven from the available evidence.
This is one reason I do not use the phrase “lossless fabric validated” based solely on queue configuration, PFC frames, and an absence of sampled drops. Headroom sizing depends on link speed, pause reaction time, frame size, topology, and traffic patterns. A two-port, one-host trial cannot demonstrate the behavior of a multi-host training cluster under incast.
07 / Latency showed the operational consequence
The most immediately understandable performance measurement came from a three-phase 64-byte RDMA SEND latency exercise with 2,000 iterations per phase. During the congested phase, background RDMA WRITE traffic ran at approximately 5.9 Gb/s. The averages were:
| Condition | Average 64-byte RDMA SEND latency |
|---|---|
| Unloaded | 1.53 µs |
| Deliberately congested | 63.57 µs |
| After recovery | 1.69 µs |
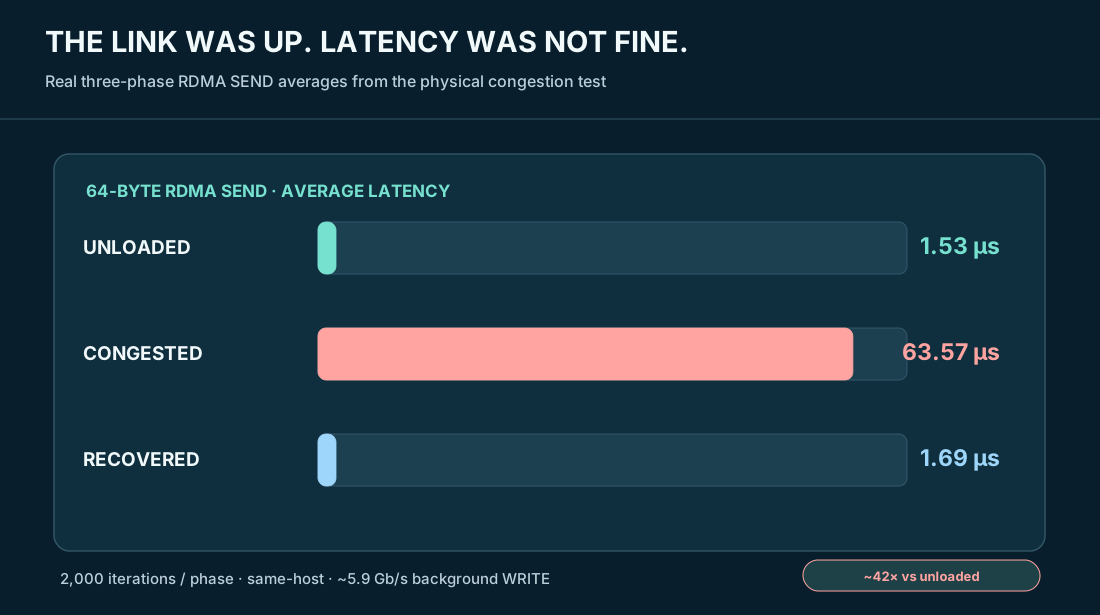
That is approximately a 42-fold increase from the unloaded average to the congested average. The recovered value returned close to baseline. It shows why a link can appear healthy in a conventional availability dashboard while a latency-sensitive workload is under pressure.
I would not generalize the result to every packet size, traffic mix, or hardware platform. The endpoints shared CPU, memory, PCIe, and NIC resources, and the small-message test had a bounded sample size. Within that scope, the experiment clearly demonstrated application-visible RDMA latency sensitivity to controlled congestion.
08 / What I would check on an AI fabric incident bridge
If a production GPU workload began stalling while all Ethernet interfaces stayed up, I would start by establishing the affected traffic class, time window, endpoints, and switch path. From there I would compare the transmitted DSCP/ECN values with the actual switch TC and queue mapping, confirm egress queue and buffer counters, and examine whether physical PFC pause frames are being sent and received on the intended priority.
Next I would correlate switch CE-marking deltas with receiver RoCE CE observations, receiver CNP transmission, and sender CNP handling. If the incident required a claim about DCQCN, I would ask for independent sender-rate evidence, not substitute switch shaping or a CNP counter for it. Finally I would line those network and adapter signals up with RDMA retry, completion, and workload-latency measurements before deciding whether a network correction improved the application.
The same investigation also has a security and operational boundary: controlled PFC, shaping, or WRED changes can affect other tenants and traffic classes. In production I would require an approved change window, known class-to-queue intent, baseline counters, rollback criteria, and checks for pause storms or unintended congestion propagation. A congestion test that destabilizes unrelated workloads is not an acceptable validation strategy.
The engineering conclusion: Project Pivot demonstrated physical priority-3 PFC signaling in one direction, ECN marking with directly correlated receiver CE counts, and CNP feedback across the adapter ports. It documented measurable RDMA latency inflation during congestion. It did not demonstrate independent DCQCN sender-rate control, full bidirectional losslessness, or multi-host GPU incast. Those boundaries are what make the measurements useful to another engineer.
Evidence trail
The original physical acceptance records and supporting reports are maintained under /home/bryan/pivot/fabric/sonic-clos/ on fabric-lab-1, with hardware captures originally collected on proxmox-r430. Relevant documentation includes:
docs/day21-final-technical-record-20261012.md— the reconciled physical acceptance narrative, final October 12 P08 counter comparison, P09 disposition, PFC and latency results, and evidence boundaries.docs/day21-p08-p10-ecn-buffer-analysis.md— queue/PG and ECN-related inspection, with earlier interim limitations superseded by the later matched P08 counter capture.docs/day21-p09-dcqcn-limitation.md— explanation of why sender rate control was not independently established.docs/day21-physical-hardware-purchase-audit-20261012.mdanddocs/purchase-objectives.md— purchase objectives, acceptance scope, and hardware limitations (use the final reconciled versions, not earlier interim rows).docs/day20-physical-roce-qos-numa-validation.md, plus Day 21 C06/C07/P12 evidence — bandwidth, congestion, QoS/PFC, and RDMA latency context.
All six figures are original editorial reconstructions based on the recorded tests. They are not substituted device screenshots or packet captures. Technical records remained subject to GitLab evidence reconciliation at the time of the October 12 acceptance note; this article does not claim independent current repository verification.
Vendor and protocol references
- Dell SmartFabric OS10 10.5.0 — User Guide, RoCE configuration and QoS
- NVIDIA — RoCEv2 Explicit Congestion Notification
- NVIDIA Cumulus Linux — PFC, ECN and buffer planning
- RFC 3168 — Explicit Congestion Notification
- IEEE 802.1Qbb — Priority-based Flow Control (overview)