A fabric can have two established BGP paths, healthy Kubernetes nodes, and a dashboard full of green indicators while an application still waits for packets that never arrive. I have dealt with versions of that problem throughout my network engineering career. In an AI environment, the investigation reaches farther into the host, RDMA transport, accelerator management, and workload itself.
Project Pivot began with a virtual SONiC Clos and grew into a physical 100GbE RoCE testbed, a Kubernetes cluster, and a separate mocked GPU-operations environment. Building each part was useful. Operating them forced a different set of questions: what should be monitored, what constitutes an actionable alarm, which changes are safe to make, how can a recovery be verified, and what evidence should survive after the incident ends?
This final article documents the practices I exercised and the operational model I would take into a larger AI infrastructure team. Some checks were demonstrated in the lab. Others are production-readiness controls I would implement next. I keep those categories separate because a proposed runbook is not a tested recovery procedure.
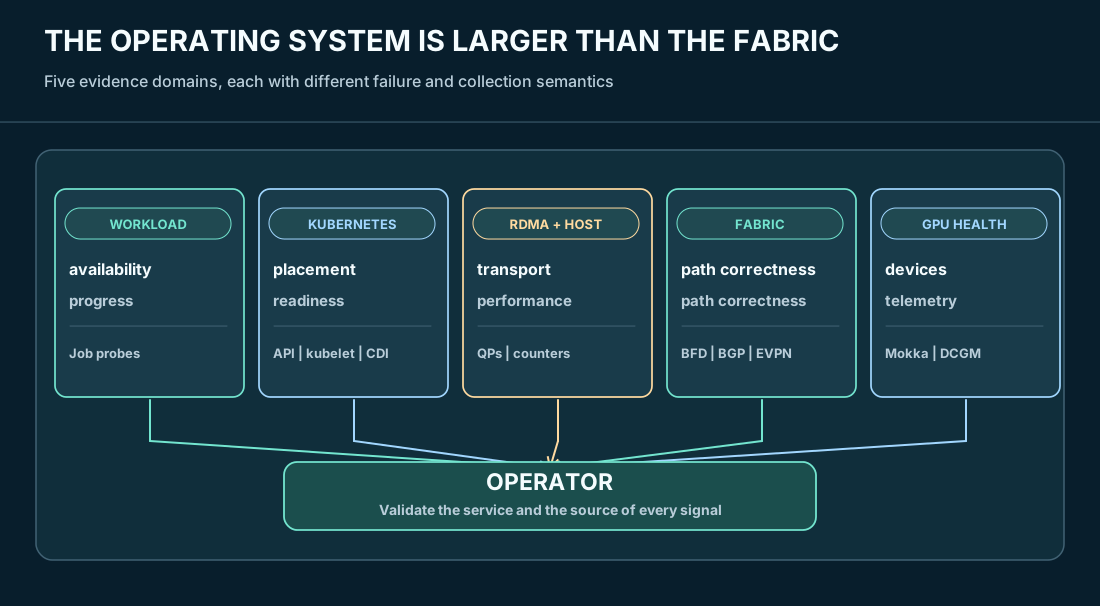
01 / Define the service before defining the alarms
The first operational decision is what the system is meant to deliver. In the SONiC lab, that meant routed endpoint connectivity and an EVPN/VXLAN overlay. In the physical testbed, it meant RDMA operations across two real ConnectX-5 ports and a Dell Z9100-ON switch. In the GPU mock environment, it meant discoverable, allocatable simulated devices and an observable GPU-health path. Those are related engineering capabilities, but they are not interchangeable service-level outcomes.
I would organize an operating baseline into four categories: availability, path correctness, performance, and observation quality. Availability asks whether the designated service flow completes. Path correctness asks whether the selected next hop or VTEP is usable. Performance asks what happened to throughput, latency, retries, or workload progress. Observation quality asks whether the collector is present, current, and reporting the correct device or workload identity.
During the Day 10 observability work, the operator view recorded a five-device SONiC fabric, four Ready Kubernetes nodes, and the pivot-web deployment at 2/2 replicas. Those were useful baseline checks, but I would never treat them as proof of GPU training throughput. The mock GPU observability work ran in its own KIND cluster, while the physical RoCE experiments used a single R430 and a dual-port HCA.
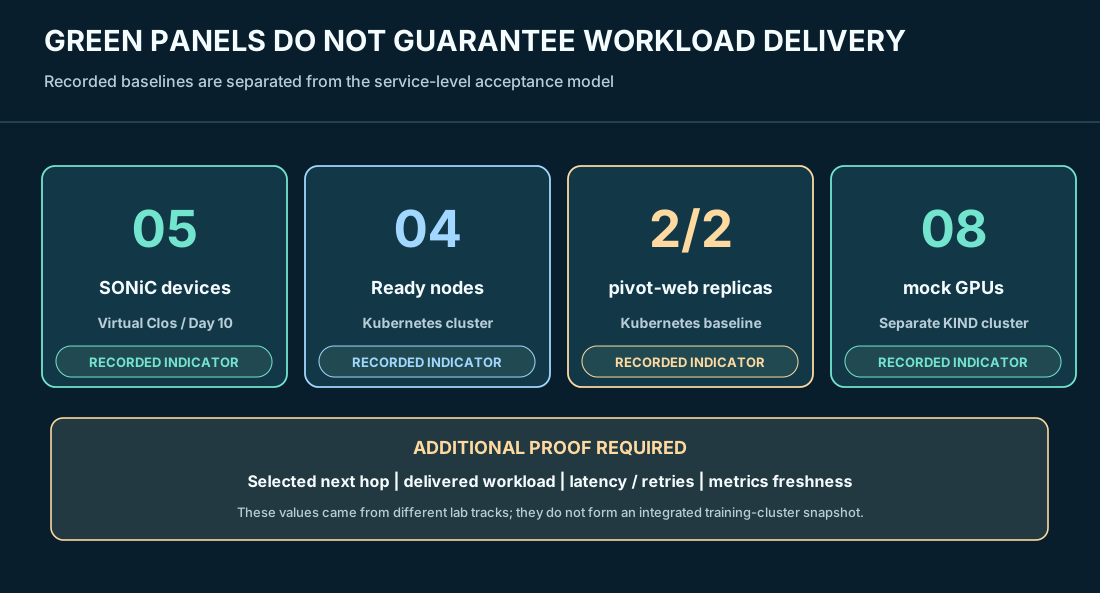
02 / Keep the monitoring pipeline accountable
On automation-1, I established Prometheus, Grafana, and Alertmanager as the common monitoring foundation. The virtual fabric supplied SONiC/FRR-related state for BFD, BGP, EVPN, interfaces, and device health. Kubernetes contributed node and workload state through the metrics stack. The separate Mokka KIND environment exposed GPU telemetry through DCGM Exporter, using the pivot-dcgm-exporter NodePort at 30400, for the Prometheus pivot-gpu scrape job.
The exporter path mattered during fault injection. A simulated Xid 79 health condition on GPU 0 reached the monitoring system and produced critical GPU alerts. That established a useful telemetry-and-alert evaluation path. It did not establish that a real H100 failed, that a CUDA kernel was interrupted, or that a complete distributed training job recovered.
The monitoring system needs monitoring of its own. I would alert separately when a target becomes unreachable, a metric stops updating, or the source identity changes. An absent counter value should not silently become a healthy value. Scrape timestamp, collection interval, label identity, and dashboard time range are all part of incident evidence. The NVIDIA DCGM exporter exposes metrics in Prometheus format; those values inherit the fidelity and limitations of their underlying source, including when the source is mocked.
I also distinguish notification from investigation. Alertmanager can route an alert and produce webhook activity, but successful delivery does not prove that a diagnostic bundle was collected or that a fault was corrected. Automated evidence gathering was demonstrated in the earlier Network SRE work; I would not silently reclassify that separate workflow as a fully integrated Project Pivot GPU-fabric incident collector.
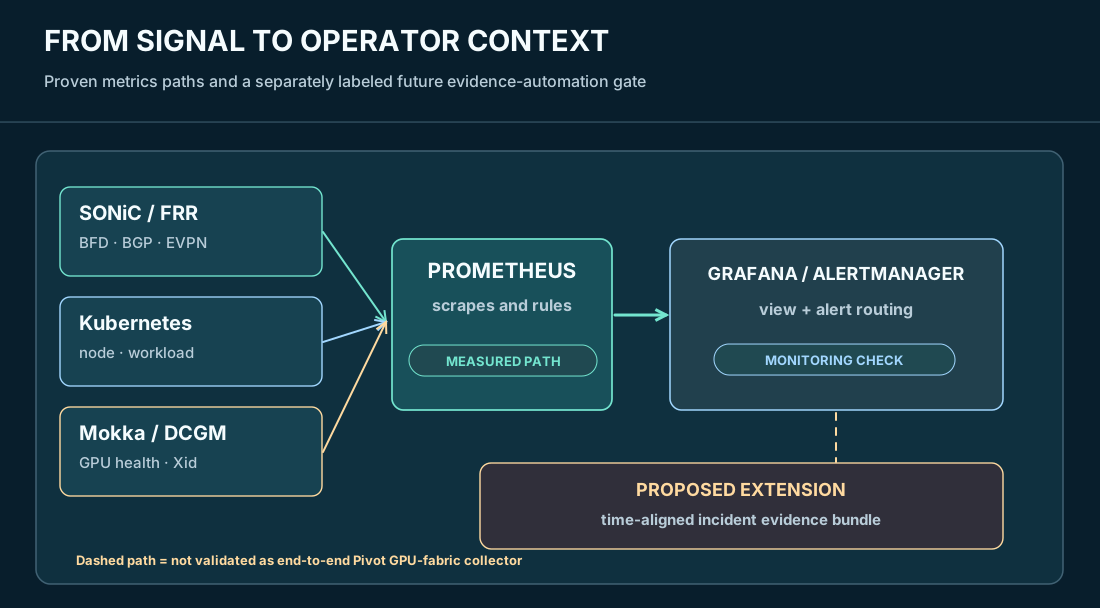
03 / Write alerts that an on-call engineer can act on
A BGP or BFD peer changing state should carry the failed device and peer, the affected time window, the expected redundant path, and a direct link to the relevant dashboard or runbook. A device-health alert should identify the node and GPU, the metric source, and whether the value is current. A queue or RDMA alert needs interface and transport context; a threshold without those labels often creates a mystery rather than shortening one.
Alerting should also reflect the topology. Losing one spine-facing adjacency in a two-spine Clos is different from losing the final next hop to a destination. One event may represent degraded redundancy while the other represents loss of forwarding. Grouping by failure domain reduces duplicate paging, while explicit escalation criteria prevent an apparent low-severity path fault from hiding an actual service outage.
I would maintain alert rules for signal, impact, and instrumentation health separately. A route change is a signal. A failed workload probe is evidence of impact. An unavailable exporter is an instrumentation fault. These can happen together, but they answer different questions. The lab demonstrated protocol and component telemetry; it did not establish measured production alert precision, paging noise, or fleet-wide service-level objectives.
That last limitation is important. I can show recorded BFD/BGP behavior and Prometheus alert activity, but I cannot invent an alerting SLO or an on-call mean time to recovery from those records. Production thresholds should come from measured workload behavior, maintenance policy, and the consequences of a missed detection.
04 / Treat every network change as a controlled experiment
The most reliable lab results came from making one bounded change, capturing pre-test state, measuring the effect, restoring the environment, and checking the baseline again. On the virtual fabric, I used validators for fabric state, routed workloads, and EVPN overlay reachability. After destroying and rebuilding the Containerlab topology from source-controlled artifacts, the fabric, workload, and overlay validators passed. That provided a concrete reproducibility check rather than faith in retained runtime configuration.
In the physical lab, the same discipline kept the test conclusions narrow. Adjusting RX rings did not eliminate the initial TCP ceiling. Rebalancing queues and NUMA-local interrupt processing produced a larger improvement. Later congestion testing correlated physical PFC and ECN/CNP observations but did not independently establish DCQCN sender-rate reduction and recovery. Each result had a scope boundary and its own evidence.
For a production change, I would enforce these gates: known source-controlled intent; supported software/firmware matrix; pre-change topology and health snapshot; explicit rollback; bounded execution; a workload-aware acceptance test; and post-change comparison with the pre-change evidence. A passing configuration parser or a successful CI job is not the same as a successful forwarding test. Neither should substitute for checking the affected service path.
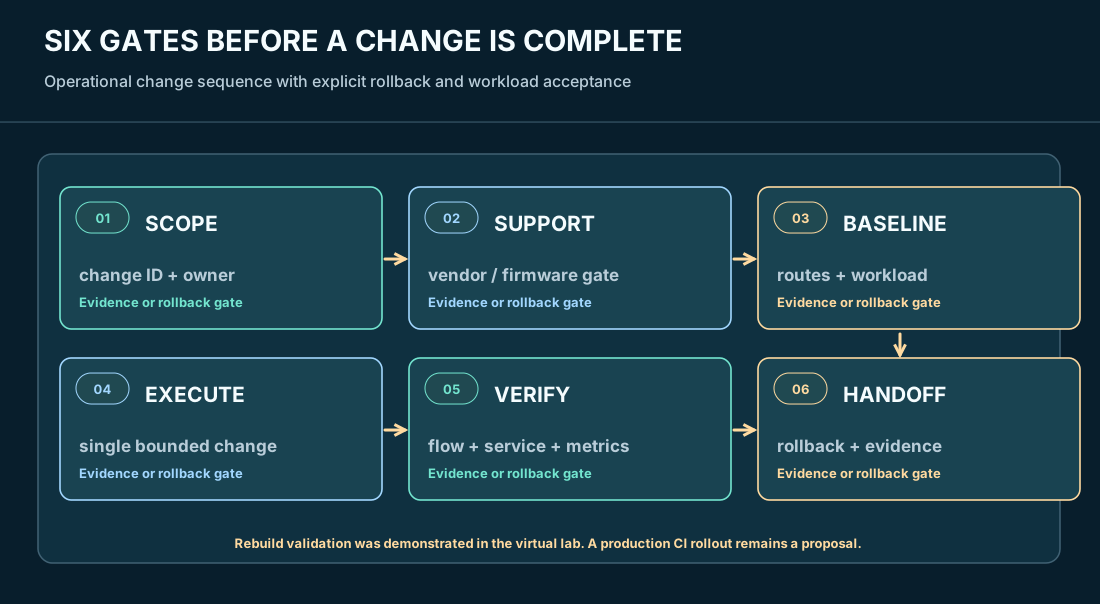
05 / Define recovery at the right layer
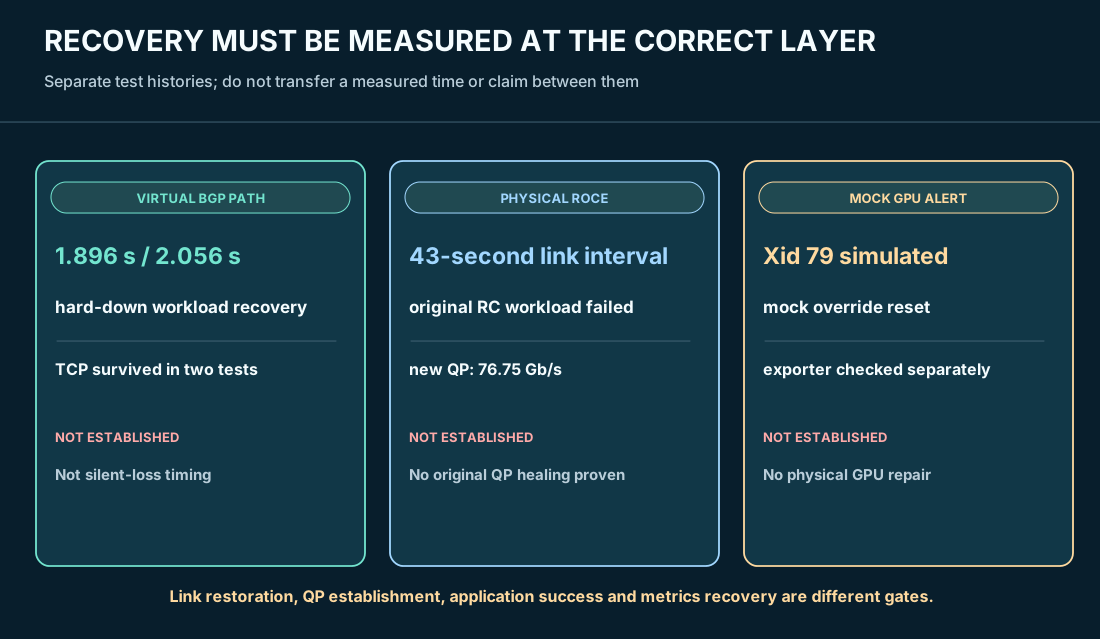
I learned early in network incident management to resist the temptation to close an event as soon as the interface returns to UP. That reflex is even more dangerous with RDMA. Physical link restoration, BGP convergence, a fresh queue-pair connection, and workload recovery can occur at different times or may not all occur at all.
In the virtual Clos, the Day 5 active-path shutdown tests measured workload recovery at 1.896 seconds and 2.056 seconds for the two tested spine paths. Both tested TCP sessions survived. Those measurements belong to hard-down failover experiments, not the later silent-forwarding fault where an interface remained up.
The physical October 8 ConnectX-5 exercise makes the boundary especially clear. The receiver-side link was observed down at 16:12:36 EDT and back up at 16:13:19 EDT, an approximately 43-second link-down interval. The original reliable-connected RDMA workload failed with status 12 and syndrome 0x81. A fresh pair of queue pairs then completed RDMA WRITE at 76.75 Gb/s. That proves fresh-connection recovery after link restoration. It does not prove that the original QP automatically healed or establish an application recovery duration.
The GPU-management exercise had a different recovery boundary. Resetting the Mokka health override removed the active simulated fault. The DCGM exporter required separate attention because process-visible history can persist after the mock state changes. A mock GPU returning to a normal state, a refreshed exporter, and an alert resolving are distinct observations. None proves physical device repair.
06 / Preserve evidence so another engineer can reproduce the conclusion
A good incident record should survive the engineer who wrote it. I want the original fault window, the exact participating nodes and interfaces, the test command or change, pre/during/post outputs, counter deltas, workload disposition, and enough software and firmware identification to reproduce the conditions. A screenshot is useful for a portfolio, but the raw data and timestamps are what make the conclusion auditable.
Project Pivot accumulated those artifacts across the virtual Clos, software RDMA, physical ConnectX-5/Z9100 experiments, and the Mokka environment. The physical Day 21 acceptance record explicitly separates ECN/CNP feedback demonstrated from independent DCQCN adaptation not established. It also records a limitation in the exact ingress priority-group mapping and excludes physical multi-host incast from the demonstrated scope. Those exclusions are part of the result, not footnotes to hide.
I would require an incident handoff to state the first disproven hypothesis as well as the accepted cause. For example, a route exists but a flow is blackholed; a NIC link is active but an RDMA completion fails; a GPU alert fires but the source is simulated; or a fresh QP succeeds while the previous session stays failed. That is the level of precision that keeps the next engineer from repeating the same investigation.
A further security requirement belongs in the evidence workflow: restrict diagnostic account permissions, avoid embedding credentials or sensitive identifiers in publications, protect API endpoints and exporter access, and define retention for packet captures and logs. Collecting everything indefinitely under privileged credentials is not an observability strategy.
07 / The production-readiness checklist
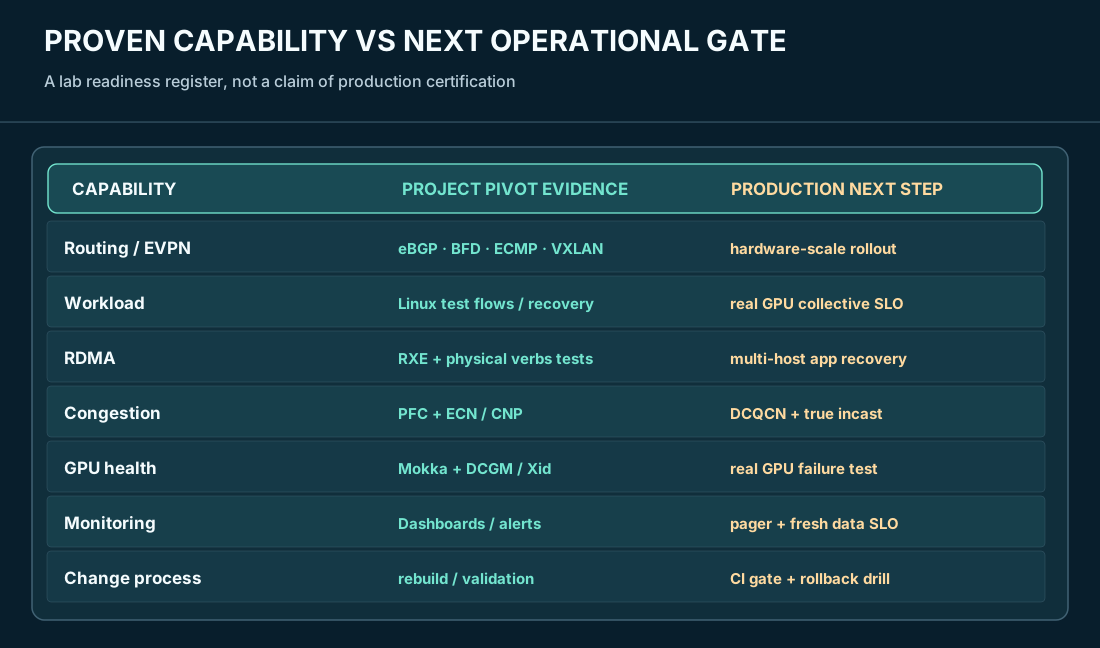
I can now separate the capabilities demonstrated in Project Pivot from the controls still needed before I would trust a larger AI fabric with a production distributed workload.
| Operational area | Evidence demonstrated in Project Pivot | Production-scale gap or next control |
|---|---|---|
| Routing and resiliency | Virtual eBGP/BFD/ECMP, EVPN/VXLAN, failover, deterministic rebuild | Multi-rack and hardware ASIC forwarding acceptance |
| Workload assurance | Linux endpoint traffic, TCP/UDP probes and recovery checks | Real distributed GPU collective behavior and workload SLOs |
| RDMA transport | RXE fault tests and physical ConnectX-5 RDMA verbs | Multi-host RDMA fleet, application-level recovery, genuine incast |
| Congestion | Physical PFC and ECN/CNP counter correlation | Independent DCQCN sender adaptation and production headroom sizing |
| GPU operations | Eight Mokka-simulated GPUs, device allocation, DCGM and Xid alerts | Physical GPU failure injection, CUDA/NCCL/GPUDirect performance |
| Monitoring and response | Prometheus/Grafana/Alertmanager components and alert evidence | Validated pager ownership, fresh-signal checks, integrated incident collector |
| Change and rollback | Source-controlled lab rebuild and measured test restoration | End-to-end gated production rollout, peer approval and rollback rehearsal |
08 / What I would hand to the next on-call engineer
For a handoff, I would want a topology and ownership map; a versioned and verified baseline; dashboards that show device identity and sample freshness; alerts tied to service impact; a small set of repeatable probes; and a recovery procedure that explicitly checks the service after the infrastructure comes back. I would also want an exceptions register. A limitation that was accepted in the lab should not disappear when the same design is discussed at production scale.
I built Project Pivot to learn the technologies that sit between established enterprise networking and modern AI infrastructure. The most valuable outcome is not a list of protocols or a 100GbE benchmark. It is a disciplined way to connect configuration, control-plane state, actual forwarding, RDMA transport outcomes, and GPU operations without claiming that an untested layer has passed.
My operating standard is simple: establish the baseline, prove the change, capture the fault, verify the service, and leave an evidence trail that another engineer can challenge. That is the foundation I would carry into an AI Fabric SRE role.
Evidence and reference notes
- Project Pivot repository:
fabric/sonic-clos/docs/day5-workload-failover.md,day6-evpn-vxlan.md,day9-observability-alerting.md,day10-cross-layer-observability.md,day15-mokka-gpu-operations-observability.md,day17-cross-layer-ai-infrastructure-incident-triage.md, andday21-final-technical-record-20261012.md. - External technical references: Kubernetes device plugin framework; NVIDIA DCGM Exporter.
- Editorial rule: figures may simplify topology and operating gates; all measured values and demonstrated claims retain their stated lab boundaries. Proposed operating controls are labeled as proposed.