01 / The network behind the alarms
The routing lab used six Cisco routers: ISP1, R1, R2, R3, R4, and ISP2. R2 and R3 formed alternative paths between R1 and R4. The ISP routers provided traffic sources and destinations at opposite ends of the topology. eBGP and route-policy tests supplied the control-plane behavior; shutdown and recovery tests supplied the incidents.
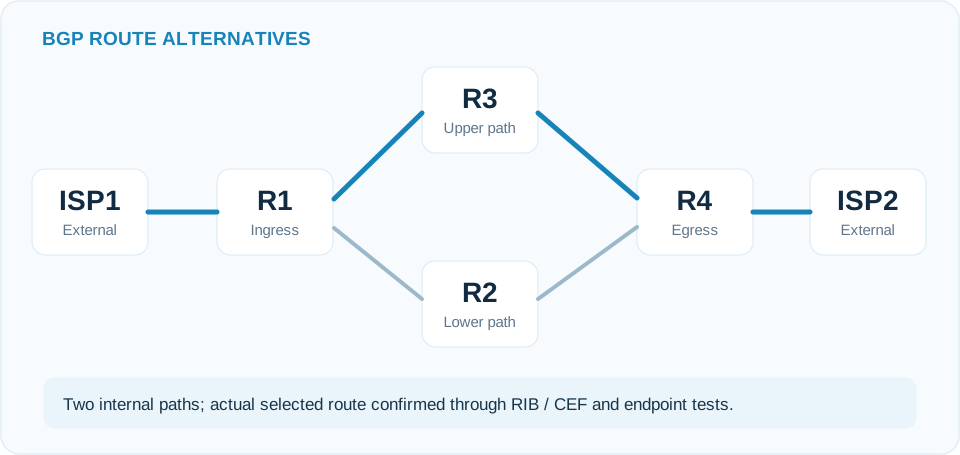
The management and monitoring services ran on automation-1. The BGP work had its own GitLab repository, bgp-sre-lab, separate from the original OSPF project and the later NX-OS VXLAN/EVPN fabric. Keeping those environments distinct is important: the evidence in this article comes from the BGP lab, not from the subsequent data-center fabric exercises.
I wanted the lab to answer practical questions. If a link was disabled, which BGP routes remained usable? Would the expected backup path be installed in the routing table? Could a collector preserve relevant device output while the failure was in progress? Would the monitoring and incident workflow distinguish an active fault from one that had already cleared?
Those tests require more than a diagram with two paths on it. A router can learn a backup route from BGP and still install a competing route from another source. That was the first important finding.
02 / The static route that changed the failover result
During the April 21 failover work, R4 had a static route to 172.16.1.0/24 pointing at 10.20.0.13. The configuration interfered with the intended BGP route selection. The prefix was present in BGP, but a routing-information-base (RIB) failure meant that the BGP path was not the one installed for forwarding.
The distinction matters. Seeing a prefix in show ip bgp does not prove that the same path is active in the routing table or Cisco Express Forwarding (CEF). Administrative distance, next-hop resolution, and route policy can change the forwarding outcome. A static route with the default administrative distance normally takes precedence over an eBGP-learned route to the same prefix.
Once the interfering static route was removed, the lab showed the BGP route installed through R3, next hop 10.20.0.17. Follow-up CEF and ping checks succeeded. Subsequent end-to-end failover testing from the ISP1 side toward ISP2 succeeded after the routing corrections. The test record also distinguished the primary R3 path from the backup R2 path and exercised a failure of the R1–R3 leg that moved traffic to R2.
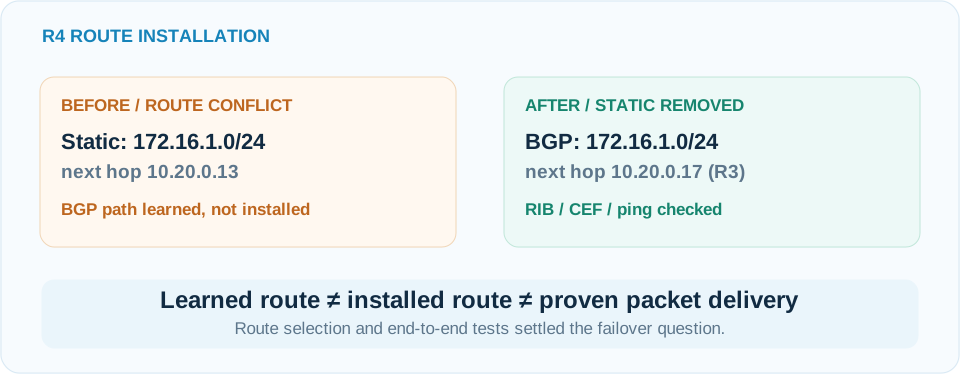
That is how I would investigate an unexpected failover in production. Start by checking what the control plane learned. Then inspect the RIB and FIB rather than assuming the advertised route became the forwarding path. Finally, test the actual source-to-destination traffic. A successful route exchange and a successful packet delivery are related observations, not interchangeable results.
03 / What the April 22 syslog record establishes
The retained April 22 incident-evidence template contains syslog from R1, not a corroborated ten-second event on R4. At approximately 18:42:00 UTC, R1 reported a BGP neighbor reset for 10.20.0.10 with an interface-flap reason. Around 18:42:02–18:42:03 UTC, it recorded Ethernet0/2 moving administratively down and the line protocol going down. These messages preserve a relationship between a routing-session event and an interface transition in the same test window.
The ordering of the displayed messages does not establish that the logged administrative shutdown preceded the BGP reset. The excerpt also does not show interface recovery, BGP reestablishment, or an exact customer-impact duration. A separate ten-second R4 Ethernet0/1 event was described in an earlier editorial version, but its underlying log was not independently corroborated during the October 16 repository audit and is not presented here as verified evidence.
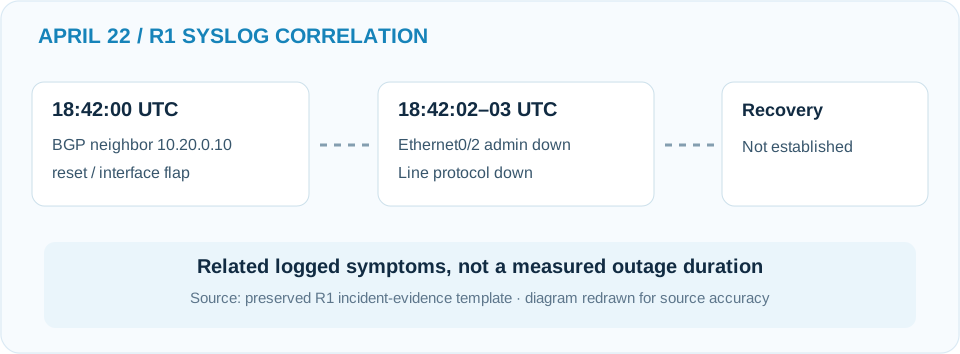
During a real incident, I would follow these logs with interface state on both endpoints, BGP session history, RIB/FIB inspection, and source-to-destination probes. A syslog timestamp is a starting point for investigation, not a substitute for verifying traffic impact and recovery.
04 / Giving each monitoring component a defined job
On automation-1, I combined Prometheus, Telegraf, Blackbox Exporter, Grafana, Alertmanager, centralized syslog, Ansible, and Python. They contributed different views of network health:
- Telegraf and device telemetry: Gather interface and device statistics where configured.
- Blackbox Exporter: Test selected endpoint reachability rather than relying only on routing-session state.
- Prometheus: Retain time-series samples and evaluate alert rules.
- Grafana: Let the operator examine related signals over the same time interval.
- Alertmanager: Group and route alert notifications to the next step.
- Syslog: Preserve messages from routers, including the sequence of interface and protocol changes.
- Python, shell scripts, and Ansible: Accept the alert event, select an investigation path, and collect supporting evidence.
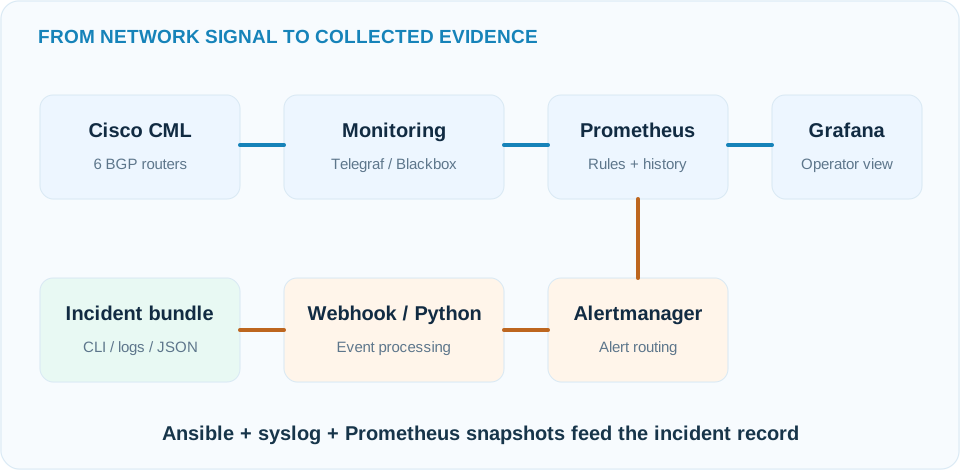
I deliberately used more than one signal type. A reachability probe can fail while a BGP session remains established. A BGP session can fail while an alternate route preserves connectivity. Interface counters can reveal symptoms that neither check explains by itself. The useful question is whether the observations tell a consistent story during the same window.
The Alertmanager event was the handoff from detection to investigation. The working webhook listener accepted a notification and initiated collection. This is different from a later, separately proposed mechanism in which a device configuration-change event would trigger GitLab CI. This BGP project demonstrated alert-to-evidence collection; it did not establish that a switch directly invoked GitLab after a configuration write.
05 / The evidence collector had its own failure modes
The early incident collection exposed an operational problem that would be familiar in any NOC. The workflow created incident directories and saved alert or Prometheus data, but some router output files were initially empty. The collection mechanism was encountering interactive SSH authentication, which prevented unattended CLI snapshots from completing reliably.
An incident folder is only useful when its contents are complete and interpretable. Empty router files, despite a successfully created directory, are a collection failure. They cannot be presented as proof that the devices had no problem.
After the SSH/Ansible collection path was corrected, the April 23 test captured device data from all six routers: ISP1, R1, R2, R3, R4, and ISP2. The recorded Ansible result showed successful tasks with zero failed hosts. The broader incident bundle included Prometheus JSON and six device syslog sources. That gave the project a much more useful operational record: monitored event context alongside device state from across the possible paths.
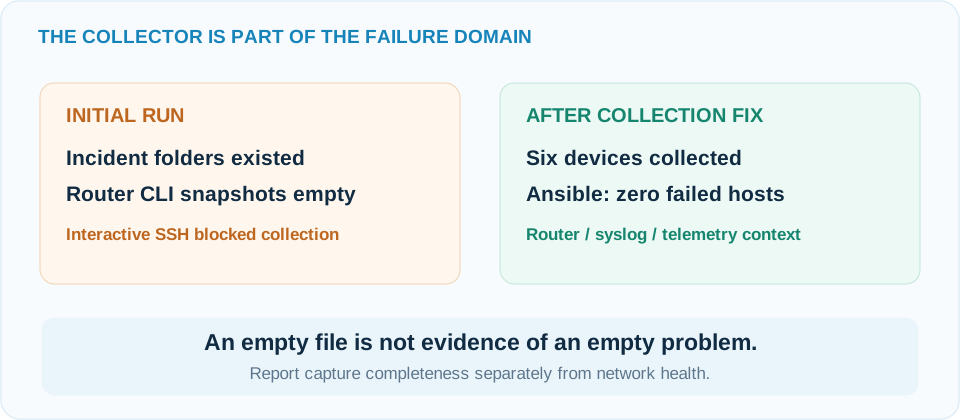
For production use, I would give every incident artifact its own status: captured, empty, failed, timed out, or not applicable. I would also preserve the collector's exit code, collection time, target identity, and credential method without storing secrets. A failure to gather evidence must be visible; otherwise the workflow can manufacture false confidence during the exact moments when operators need reliable information.
06 / When an interface alarm has already cleared
The later incident-processing exercises tested interpretation of alert data rather than only gathering it. On April 30, the parser correctly extracted a firing InterfaceAdminDown event for ISP2 Ethernet0/2 from an Alertmanager payload. Other revisions revealed ordinary software defects along the way, including a Python NameError and a stale output file that initially looked like a successful result. Those were corrected through subsequent testing, not hidden from the technical record.
By May 5, an end-to-end processing run handled an InterfaceErrorsIncreasing event for R2 Ethernet0/0. The event was classified as INTERFACE_ERRORS_INCREASING, and the decision was INVESTIGATE, with a suggested Ansible investigation path. A May 6 evidence set also included an interface report with 189 output errors and 189 collisions, while associated BGP neighbor checks were up. That combination was a reason to inspect the interface and traffic path rather than automatically tear down an otherwise functioning adjacency.
A separate live auto-investigation of an InterfaceOperDown event against R2 Ethernet0/0 obtained up/up state at investigation time and classified the event as RESOLVED. The finding was consistent with a transient condition or alert that had cleared before collection. The later test-mode exercise preserved intentionally down/down input and returned OPEN. That comparison mattered because the software had to distinguish the original alert from the live state found afterward.
| Signal or observation | What the test supports | What it does not establish |
|---|---|---|
| BGP neighbor reset during an interface flap | A control-plane interruption aligned with a link event | Duration of customer-facing impact |
InterfaceErrorsIncreasing on R2 |
A reason for investigation; actual counter evidence was obtained | Automatically safe remediation |
| Live interface found up/up after down alert | The reported fault was not active at collection time | That no traffic loss occurred during the original event |
| Test-mode interface intentionally down/down | Workflow can preserve an active-state finding | That synthetic input represents a separate production outage |
These tests are why I care about event time and observation time as separate fields. A correct alert can be stale by the time a collector runs. A live snapshot can be healthy even though the incident was real ten minutes earlier. Both facts belong in the record.
07 / Recovery requires a forwarding check
For my incident closeout, I want to see more than an Alertmanager event marked resolved. The operational checks depend on the failure, but for this BGP environment they would include neighbor state, expected routes in the RIB, next-hop selection in CEF, and a source-to-destination connectivity test through the intended path. Where a failover is part of the design, I want to verify that a redundant path actually took over.
That approach is grounded in the R4 static-route finding. BGP could know about a route without forwarding along it. A green peer-state panel would not have revealed the conflicting static entry. Checking the installed route, forwarding adjacency, and endpoint test exposed the difference.
It is also grounded in the preserved April 22 R1 syslog messages. By the time an engineer examines the router, the neighbor may be established again. The past event still happened. A good incident record includes the transient evidence and the current checks, making it possible to separate what failed, what recovered, and what effect was actually demonstrated.
08 / Limits, hardening, and security controls
This project proved that an independent BGP lab could combine monitoring, alert routing, a webhook listener, scripted incident handling, and router evidence collection. It also showed the weaknesses that appear before a prototype is dependable enough for unattended operational use.
The early empty CLI files and the later Python exception are examples of partial failure. Repeated alerts introduce another problem: without stable incident identifiers, deduplication, and rate limits, a short flap can create a flood of collections. The project included later pattern and threshold work, but I would not describe it as a fully production-hardened event-correlation service.
Security is part of that boundary. A production webhook receiver should authenticate callers, limit the request body size, validate the event schema, prevent alert fields from becoming shell arguments, and enforce concurrency and rate limits. Read-only collection accounts should be separated from device-changing credentials. Sensitive hostnames, management addresses, tokens, and syslog content should be sanitized before publication or wider sharing. Evidence should be timestamped, access-controlled, and retained under a documented policy.
I also want an explicit human decision point for remediation. The lab's classifier and action recommendations demonstrate structured triage. They do not establish that unattended configuration changes or rollback are safe. A BGP failover problem caused by a static route is a useful warning: removing configuration automatically without understanding why it exists can create a second failure.
09 / The operating lesson
I started the BGP project wanting better visibility during a fault. The most useful result was a repeatable way to connect an alarm to routing evidence, logs, and a defensible explanation of what the network did.
The April routing test exposed a static route masking the BGP forwarding path. The April syslog test preserved a brief interface/BGP interruption. The first collector runs exposed missing CLI evidence, and subsequent Ansible work captured all six devices. The May exercises showed that a live interface can already be healthy when the incident handler processes a down alert, and that alert classification has to be tested like any other software.
Those findings changed what I look for in a monitoring workflow. The operator needs the time window, path, relevant device state, collection quality, and recovery criteria together. A dashboard is an excellent place to start an investigation. The incident record has to carry the engineering explanation.
The next Network SRE article will move into the Cisco NX-OS VXLAN EVPN fabric, where routing health must be evaluated alongside NVE peers, VNIs, and endpoint reachability. That adds new places for the observed state and the actual forwarding behavior to disagree.
Source record and editorial review notes
This article documents an independent Cisco CML lab and related April–May 2026 execution records. It does not depict a production customer incident. The work was performed in the separate bgp-sre-lab repository on automation-1, last identified at checkpoint 558a187 (May 8, 2026). Relevant retained files include PHASE2_SUMMARY.md, PHASE3_COMPLETION.md, webhook_listener.py, collect_incident.sh, parse_alert.py, run_incident_workflow.sh, incident_summary.py, and playbooks/collect_incident.yml.
The figures are original editorial reconstructions, not authentic CLI, Prometheus, Grafana, or GitLab screenshots. Before final public publication, the original device logs, saved incident folders, May classifier output, and figure annotations should be reconciled against the live repository and sanitized artifacts. This article does not assign unverified convergence times, impact counts, or fabricated GitLab job IDs.