A network can look healthy to its operators and still be failing the traffic it was built to carry. Every BGP neighbor may show Established. Every dashboard can report that its exporters are reachable. The intended configuration may match the repository. None of those observations, alone, guarantees that a particular application can reach its destination through the intended path.
That gap became hard to ignore across three independent Cisco CML exercises I built for my Network SRE work: an OSPF configuration-management baseline, a six-router BGP incident-response lab, and a Cisco NX-OS VXLAN EVPN fabric. The lab records contain several concrete examples. One router learned a BGP path but installed an interfering static route. A short interface flap reset a BGP session without a retained measurement of user traffic loss. An incident collector created apparently successful case folders while leaving device snapshots empty. And an EVPN tenant's L3 VNI was down despite working underlay routing.
The next engineering question is how to measure the service through those conditions. I can tell an operator which protocol failed and when it recovered. Can I also prove whether the service experienced unacceptable loss, delay, or interruption? Only if I define those measurements, collect them from the right places, and preserve their limitations.
Evidence boundary. This article uses actual recorded lab findings to motivate a proposed service-level measurement framework. The earlier labs had Prometheus, Grafana, Blackbox Exporter, Telegraf, syslog, Alertmanager, pyATS, and Ansible in various workflows. They did not establish a complete production-grade network SLO system, continuous per-flow loss accounting, or a verified 30-day error-budget history. All proposed SLO numbers below are worked examples, not measured performance claims.
01 / Begin at the source and destination
My Tier-3 troubleshooting work taught me to establish the incident time, source IP, destination IP, protocol, and ports before chasing an alarm. That habit is just as useful for defining network reliability. A device-centric objective such as “all routers up” tells me something about equipment. A service-centric objective tells me whether an authorized source can complete the transaction that matters.
In the separate six-router BGP lab, ISP1 and ISP2 sat at opposite ends of a topology with R1 and R4 connected through alternative R3 and R2 transit paths. An appropriate service check would start on the ingress side and verify a destination reachable beyond the egress. It would record which source and destination were tested, when the test ran, whether it succeeded, and how the selected route changed.

A ping from automation-1 to a router management interface would not be a substitute for that test. It exercises a different source, destination, access policy, and potentially a different forwarding path. The network may preserve management reachability while the tenant or application path fails. Similarly, a successful probe through one ECMP hash bucket does not establish that every member path is healthy. I would document the vantage point explicitly and add more probes when distinct paths or tenants matter.
02 / Four states that operators often confuse
There are at least four useful questions to ask about a change or failure. Does the configuration match approved intent? Are the routing and overlay protocols exchanging the expected information? Is the correct next hop actually installed in the forwarding plane? Can the relevant service complete its operation?
Those questions overlap, but each can answer “yes” while the next answers “no.”

The BGP lab provided a concrete example. On R4, a static route to 172.16.1.0/24 via 10.20.0.13 interfered with the intended BGP selection. The BGP table knew about another path, but that path was not installed in the routing table. After removing the conflicting route during the lab correction, R4 installed the BGP path through R3, next hop 10.20.0.17; subsequent RIB, CEF, and ping checks succeeded. Later fault testing exercised the alternative path via R2.
The lesson for measurement is specific: a BGP session metric belongs in the diagnostic layer, while the service probe belongs at the acceptance layer. If those disagree, do not smooth the disagreement away in a dashboard summary. That disagreement is the investigation.
The EVPN lab exposed the same hierarchy in a different way. The fabric had two spines, three leaves, OSPF underlay transport, and MP-BGP EVPN overlay signaling. A tenant L3 VNI, 99999, remained down until the Vlan999 routing SVI was corrected with ip forward. Correct OSPF adjacencies had not guaranteed that tenant routing was operational. Here, the acceptance path spans underlay, EVPN routes, NVE peers, VNI state, route installation, and a representative endpoint transaction.
03 / Define a service-level indicator that can be audited
For a network path, my starting SLI would be the fraction of valid probe attempts that complete successfully from a named source to a named destination within a defined timeout. For a business application, it is usually stronger to measure successful transactions at the application boundary. An ICMP probe should be described as ICMP reachability, not “the application was healthy.”
The measurement contract must state the probe type; source and destination; VRF, tenant, or interface context; expected outcome; probe interval and timeout; observation period; ownership; and how invalid or unknown attempts are handled. If latency matters, define an explicit threshold such as a round-trip time ceiling, and distinguish probe completion time from application response time. A Blackbox Exporter probe may report probe_success, but the meaning of success is determined by the probe module and its target. Prometheus Blackbox Exporter documentation explains the probe types and timing metrics.
For a simple success-ratio SLI:
SLI = successful valid attempts / all valid attempts × 100%.
This definition seems obvious until collection itself fails. The BGP lab's early incident collector generated directories with empty router CLI snapshots because interactive SSH authentication prevented unattended collection. Later Ansible work captured the required device evidence from all six routers, with zero failed hosts in the recorded run. In an SLO system, a blank test interval deserves its own category. An unobserved attempt must not silently become a successful attempt.

My preferred design reports two measurements: service SLI from valid service attempts, and measurement coverage describing how much of the planned observation window was actually evaluated. When an observation is missing, the policy must say whether it counts as an error or is excluded as invalid; either decision has consequences. I would publish the unknown/coverage count next to the service SLI, and page separately when the observer is blind. This prevents a conveniently empty time series from masquerading as perfect reliability.
04 / A short event can disappear between samples
The April 22 BGP evidence template preserves R1 syslog showing a reset of neighbor 10.20.0.10 at 18:42:00 UTC and subsequent Ethernet0/2 administrative-down and line-protocol events at 18:42:02–18:42:03. The previously described R4 ten-second event interval could not be independently corroborated. Neither device log establishes customer packet-loss duration. The sampling diagram below is illustrative, not a measured outage.
A monitoring probe is only as informative as its sampling schedule. A polling system that samples on either side of a brief failure may report two successful observations and never catch the failed interval. Scrape, evaluation, notification, and incident-collector timing add additional uncertainty. An event log can preserve the control-plane change even when sparse service probes missed it. Conversely, the probes may register application impact while BGP neighbors remain Established.
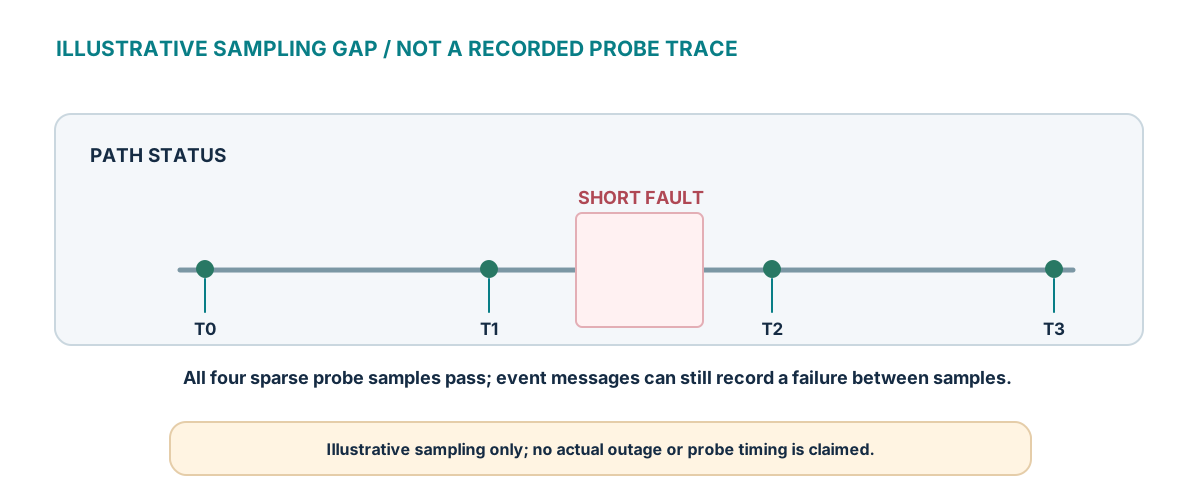
For a serious forwarding-recovery experiment, I would use timestamped active probes at a cadence chosen to resolve the expected outage length, plus device syslog and forwarding-state evidence. I would not call two consecutive successful one-minute scrapes “zero loss.” If the network is carrying delay-sensitive traffic, a purpose-built active measurement protocol may be more appropriate than general dashboard checks. For example, IETF RFC 8762 describes STAMP for packet delay, delay variation, and loss measurements. That is a possible future tool, not a claim it ran in these Cisco labs.
05 / What should count as a good event?
Reliability depends on the service contract. For a transaction that must complete quickly, a delayed success might be a bad event even though connectivity eventually returned. For bulk transfers, success may be more important than a brief latency increase. For a network providing alternate paths, route reconvergence is a mechanism, while continuity of the customer transaction is the outcome.
I would define three candidate SLIs and choose only those that reflect a real requirement:
| Proposed SLI | Good event | Important limitation |
|---|---|---|
| Path availability | Named source reaches named destination within a timeout | One probe does not test all tenants, directions, or ECMP choices |
| Transaction success | Representative application exchange completes correctly | Application errors may not be network-caused; ownership must be agreed |
| Latency compliance | Successful transaction completes below agreed limit | Probe location, timeout, and latency distribution matter |
A useful service definition also needs direction. A successful request can still have a failing return path, and source NAT or policy routing can make the two directions behave differently. For VXLAN, an endpoint inside the tenant VRF tells a different story from a probe terminating on the leaf management IP. I would require the test plan to identify the actual traffic class and path scope before building any alert rules.
This is the point where Network SRE becomes more operational than a collection of routing scripts. The metric has to be owned by the team responsible for the service, not defined in isolation by whichever engineer happens to administer Prometheus.
06 / Give the reliability target a denominator and a time window
Once the indicator is reliable, an SLO adds a target over a defined reporting window. As a worked example only, consider a hypothetical 99.9% availability objective for a service over a fixed 30-day period. The allowed unsuccessful fraction is 0.1%. If measuring continuous time as available/unavailable minutes, a 30-day period is 43,200 minutes, so the allowance is 43.2 minutes. If instead measuring discrete probe attempts, the budget is a number of failed valid attempts, not necessarily an equal duration. These models are not interchangeable when probes are sparse or irregular.

I would never select 99.9% simply because it looks respectable in a dashboard. The threshold has to follow the consequence of a failed operation and the tolerance of the service owner. Google’s SRE treatment of error budgets explains why objectives are jointly defined with the teams accountable for service risk rather than imposed as decorative network KPIs.
The policy must also address planned maintenance. If a maintenance window is excluded from an objective, that exception should be written down before the outage, not after it. Otherwise, a reliability report becomes a negotiation over which failures to count. The report should provide the numerator, denominator, exclusions, observation coverage, reporting window, and evidence source so another engineer can reproduce it.
07 / Separate service paging from diagnostic alerting
I still want BGP adjacency alarms, CRC or output-error trends, interface-down events, EVPN route changes, and unreachable exporters. They are valuable diagnostic signals. But not every symptom deserves an immediate page to the service owner.
A protocol alarm with no measured service effect may warrant a network ticket or a redundancy-risk notification. A service probe failing while protocol dashboards are green should be treated as urgent evidence that the monitoring perspective is incomplete. A collector timeout requires attention to the observability system itself. Keeping those paths distinct reduces the temptation to add another dozen noisy alerts every time an outage is difficult to explain.

For mature services, I would consider error-budget burn-rate alerts rather than paging on each short-lived symptom. Google’s SRE Workbook guidance on alerting against SLOs describes multiwindow burn-rate approaches and their tradeoffs. Those formulas assume meaningful SLI inputs. There is no shortcut where a burn-rate rule fixes a poorly chosen source, a misleading probe, or missing data.
One particularly dangerous shortcut is treating absent Prometheus samples as zero errors. Prometheus documents absent_over_time() for recognizing missing time-series data and rate() for counter calculations, including reset handling; those functions serve different purposes. I would test both successful and absent-data paths before trusting a rule in production. Prometheus query function reference.
08 / Bring the service objective into the change pipeline
Article 5 examined the VXLAN lab's GitLab sequence of validate, deploy, baseline, and post_validate. The reviewed pipeline had manual deployment and baseline controls, and its actual order placed baseline promotion before post-validation. That was a governance weakness: a collected state might be promoted before proving the changed network was healthy. The drift checker also had a blind spot for new current-only configuration files absent from the previous baseline.
A future change gate should use the same service indicator before and after a change. The prereq is a clean known-good baseline with explicit observation coverage. After a controlled change, the gate should confirm protocol health, RIB/FIB state, the actual service probe, and any regression relative to the prechange observation. Only then should an approved reviewer promote a new configuration baseline. I would retain raw artifacts and a machine-readable summary whether the job passes or fails.

The original VXLAN pipeline #124 / Job #190 provides useful evidence for part of this design: it reported OSPF FULL, NVE up, and required VNI up on three leaf switches and successful Ansible collection from five NX-OS devices. The printed excerpt did not establish that every endpoint transaction was exercised as a CI service gate. That missing assertion is exactly what a service-oriented extension should add.
The same principle applies to incident response. When Alertmanager called the BGP lab’s Python webhook, an incident bundle could preserve event context and later device snapshots. The first iterations taught me not to equate a created directory with successful collection. A future service SLI pipeline must include similarly explicit collection integrity checks and preserve the incident and measurement clocks as separate fields.
09 / A practical adoption plan, without inventing measurements
I would implement this in stages. Start with a small, named critical path where the service owner can describe a real failure. Set up a probe at the source that actually exercises that path, and a second independent observation when the topology warrants it. Retain probe outcomes, scrape health, logs, route/FIB snapshots, and a reproducible timebase. Deliberately break the path in a lab so a failed service transaction, an alert, and the relevant device changes can be correlated.
Once the collection is trustworthy, define an SLI over a trial period and examine the invalid, absent, and ambiguous samples. Review the service owner's tolerance before selecting an SLO. Then compare the proposed SLO alert against real incidents and false pages. Only after that would I make the metric a production change gate or an error-budget policy. A healthy measurement system is a prerequisite for an honest percentage.
The next checks I would add to the existing labs are deliberately specific: prove that a single-path BGP failure reaches the expected alternate hop while a source-to-destination probe records the interruption; show both protocol and tenant-service outcomes when an EVPN L3 VNI is disabled in a controlled environment; and deliberately break the evidence collector to verify that dashboards report unknown rather than a false pass. Those are future experiments, not results established by these source records.
10 / What reliability engineering changes about a network report
The difference between a useful reliability report and a green dashboard is what happens when they disagree. A router can learn BGP without forwarding on that path. An interface can recover before the engineer arrives. A collector can save an empty artifact. An EVPN fabric can have functioning underlay routing while a tenant VNI is down. Each observation in my lab forced a narrower, more careful claim.
A service-level indicator makes that discipline repeatable. It declares exactly what was tested, from where, how often, with what definition of success, and what happened when the measurement system could not see. An SLO gives the service owner an explicit tolerance for the failures that remain. The protocol logs, snapshots, GitLab evidence, and Grafana panels then help explain why the service measurement changed.
The next time a dashboard is green during a network complaint, I want a path-specific service measurement beside it. If that measurement is failing, the network is not done investigating. If the measurement is missing, we do not yet know enough to declare the service healthy.
Evidence notes and technical references
Independent lab sources. The six-router bgp-sre-lab (April–May 2026) supplied the R4 static-route/BGP RIB conflict, the preserved April 22 R1 interface/BGP syslog excerpt, Ansible incident-collection recovery and the alert-versus-live-state distinction. The separate vxlan-evpn-sre-lab supplied the L3 VNI 99999 / Vlan999 correction and archived GitLab pipeline #124 / Job #190 validation excerpt. The sampling figure is conceptual, not a measurement from either lab. The OSPF lab provided a separate configuration-management foundation.
Not verified as implemented. A production SLO, 30-day availability series, error-budget alert, continuous path-specific active measurement, and integrated pre/post-change service gate were not demonstrated in these original Cisco CML records. Figures are original explanatory diagrams; illustrations are labeled. The 99.9% target is entirely hypothetical. Network path addresses and lab observations are retained only where earlier evidence already supports them. Reconcile claims against the underlying raw logs and GitLab commit before publication.
Primary references. Google SRE on SLOs and error budgets; Google SRE Workbook on SLO alerting; Prometheus Blackbox Exporter; Prometheus query functions; IETF RFC 8762: STAMP.